測試效能分析
當您執行 Vitest 時,它會回報多項測試的時間指標:
bashRUN v2.1.1 /x/vitest/examples/profiling ✓ test/prime-number.test.ts (1) 4517ms ✓ generate prime number 4517ms Test Files 1 passed (1) Tests 1 passed (1) Start at 09:32:53 Duration 4.80s (transform 44ms, setup 0ms, collect 35ms, tests 4.52s, environment 0ms, prepare 81ms) # Time metrics ^^
- Transform (轉換):檔案轉換所花費的時間。請參閱 檔案轉換。
- Setup (設定):執行
setupFiles所花費的時間。 - Collect (收集):收集測試檔案中所有測試案例所花費的時間。這包括匯入所有檔案依賴項所花費的時間。
- Tests (測試):實際執行測試案例所花費的時間。
- Environment (環境):設定測試環境
environment所花費的時間,例如 JSDOM。 - Prepare (準備):Vitest 準備測試執行器所花費的時間。
測試執行器
若測試執行時間過長,您可以產生測試執行器的效能分析報告。請參考 NodeJS 文件了解以下選項:
WARNING
因 node:worker_threads 的限制,--prof 選項不適用於 pool: 'threads'。
若要將這些選項傳遞給 Vitest 的測試執行器,請在您的 Vitest 設定中定義 poolOptions.<pool>.execArgv:
import { defineConfig } from 'vitest/config';

export default defineConfig({
  test: {
    pool: 'forks',
    poolOptions: {
      forks: {
        execArgv: [
          '--cpu-prof',
          '--cpu-prof-dir=test-runner-profile',
          '--heap-prof',
          '--heap-prof-dir=test-runner-profile',
        ],

        // 若要產生單一效能分析報告
        singleFork: true,
      },
    },
  },
});import { defineConfig } from 'vitest/config';
export default defineConfig({
test: {
pool: 'threads',
poolOptions: {
threads: {
execArgv: [
'--cpu-prof',
'--cpu-prof-dir=test-runner-profile',
'--heap-prof',
'--heap-prof-dir=test-runner-profile',
],
// 若要產生單一效能分析報告
singleThread: true,
},
},
},
});測試執行後會產生 test-runner-profile/*.cpuprofile 和 test-runner-profile/*.heapprofile 檔案。請參閱 檢查效能分析記錄 以了解如何分析這些檔案的說明。
請參閱 Profiling | Examples 以取得範例。
主執行緒
分析主執行緒有助於偵錯 Vitest 使用 Vite 的方式以及 globalSetup 檔案。 此處也是 Vite 外掛執行的位置。
為此,您需要將參數傳遞給執行 Vitest 的 Node 程序。
$ node --cpu-prof --cpu-prof-dir=main-profile ./node_modules/vitest/vitest.mjs --run
#      ^^^^^^^^^^^^^^^^^^^^^^^^^^^^^^^^^^^^^^                                  ^^^^^
#               NodeJS 參數                                           Vitest 參數
測試執行後會產生 main-profile/*.cpuprofile 檔案。請參閱 檢查效能分析記錄 以了解如何分析這些檔案的說明。
檔案轉換
若測試轉換與收集時間過長,可使用 DEBUG=vite-node:* 環境變數查看哪些檔案正在被 vite-node 轉換和執行。
$ DEBUG=vite-node:* vitest --run

 RUN  v2.1.1 /x/vitest/examples/profiling

  vite-node:server:request /x/vitest/examples/profiling/global-setup.ts +0ms
  vite-node:client:execute /x/vitest/examples/profiling/global-setup.ts +0ms
  vite-node:server:request /x/vitest/examples/profiling/test/prime-number.test.ts +45ms
  vite-node:client:execute /x/vitest/examples/profiling/test/prime-number.test.ts +26ms
  vite-node:server:request /src/prime-number.ts +9ms
  vite-node:client:execute /x/vitest/examples/profiling/src/prime-number.ts +9ms
  vite-node:server:request /src/unnecessary-file.ts +6ms
  vite-node:client:execute /x/vitest/examples/profiling/src/unnecessary-file.ts +4ms
...
此分析策略能有效識別由 barrel files 造成的不必要轉換。 如果這些日誌包含在測試執行時不應載入的檔案,這可能表示您的 barrel files 不必要地匯入了某些檔案。
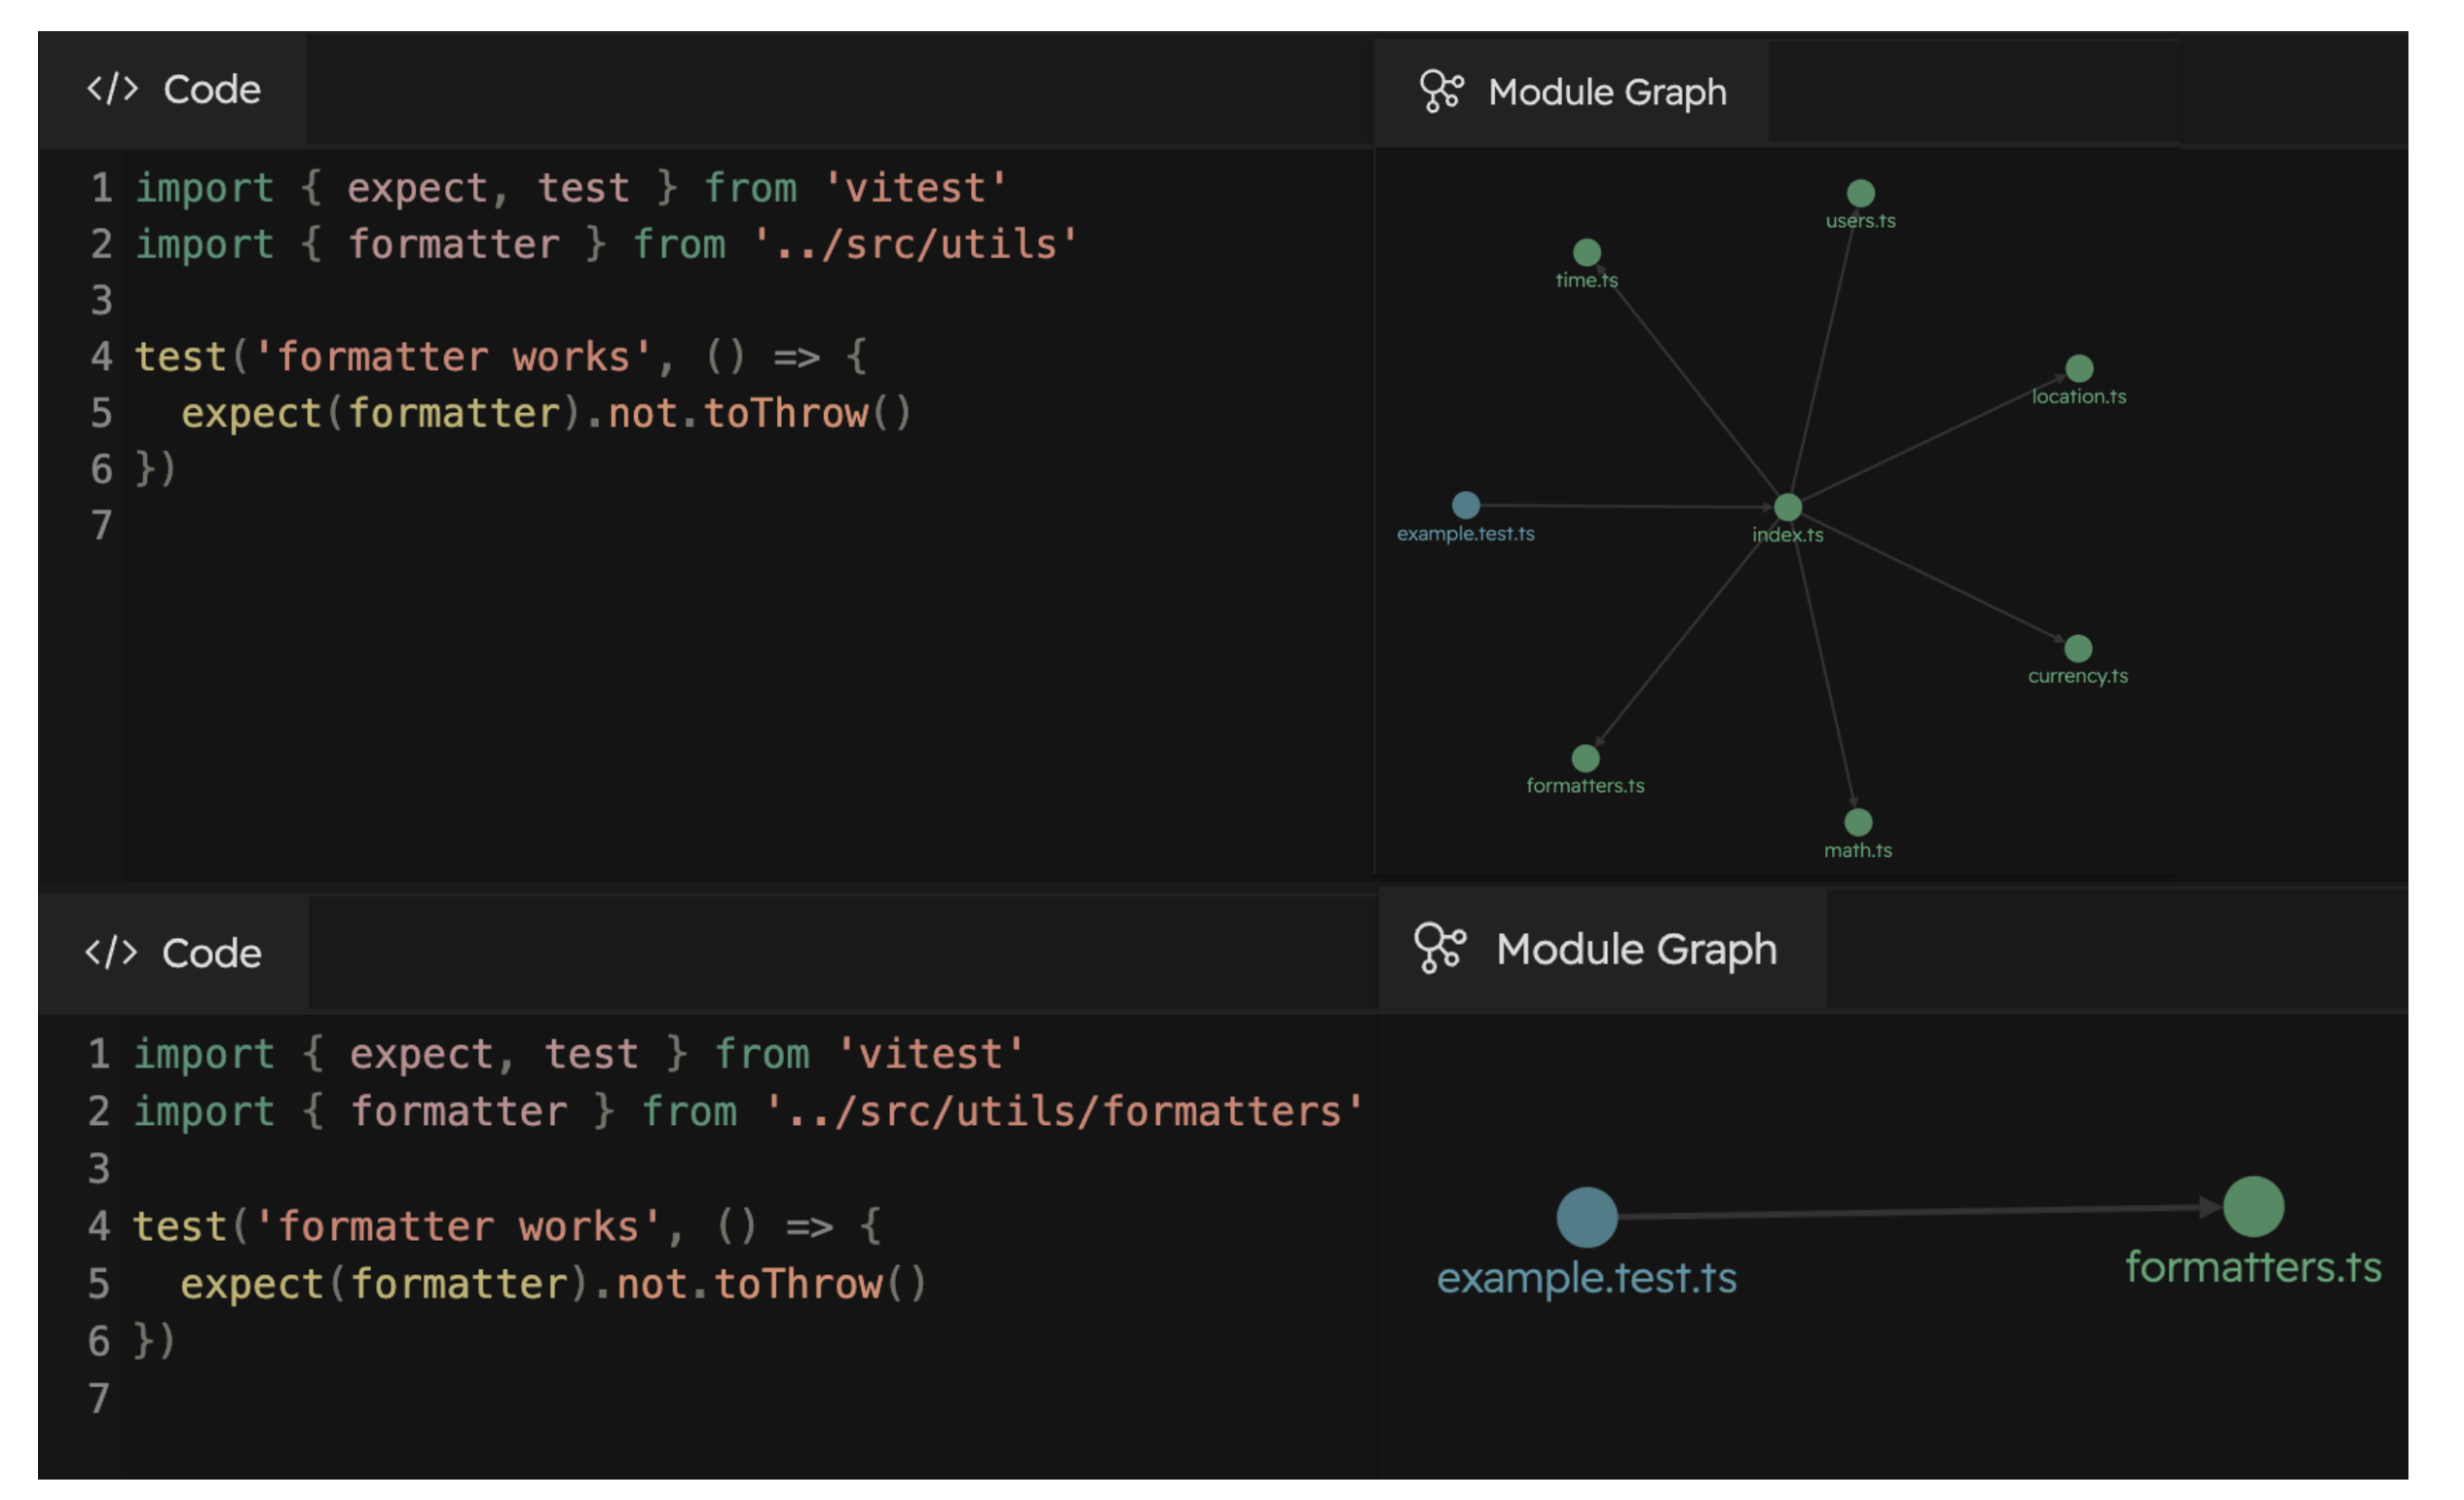
您也可以使用 Vitest UI 來排查由 barrel file 引起的緩慢問題。 以下範例展示如何在不使用 barrel file 的情況下匯入檔案,從而將轉換的檔案數量減少約 85%。
├── src
│   └── utils
│       ├── currency.ts
│       ├── formatters.ts  <-- 要測試的檔案
│       ├── index.ts
│       ├── location.ts
│       ├── math.ts
│       ├── time.ts
│       └── users.ts
├── test
│   └── formatters.test.ts
└── vitest.config.tsimport { expect, test } from 'vitest';
import { formatter } from '../src/utils';
import { formatter } from '../src/utils/formatters';
test('formatter works', () => {
expect(formatter).not.toThrow();
});
若要查看檔案如何轉換,您可以使用 VITE_NODE_DEBUG_DUMP 環境變數將轉換後的檔案寫入檔案系統:
$ VITE_NODE_DEBUG_DUMP=true vitest --run

[vite-node] [debug] dump modules to /x/examples/profiling/.vite-node/dump

 RUN  v2.1.1 /x/vitest/examples/profiling
...

$ ls .vite-node/dump/
_x_examples_profiling_global-setup_ts-1292904907.js
_x_examples_profiling_test_prime-number_test_ts-1413378098.js
_src_prime-number_ts-525172412.js
程式碼覆蓋率
若專案中程式碼覆蓋率產生速度緩慢,可使用 DEBUG=vitest:coverage 環境變數啟用效能日誌記錄。
$ DEBUG=vitest:coverage vitest --run --coverage

 RUN  v3.1.1 /x/vitest-example

  vitest:coverage Reading coverage results 2/2
  vitest:coverage Converting 1/2
  vitest:coverage 4 ms /x/src/multiply.ts
  vitest:coverage Converting 2/2
  vitest:coverage 552 ms /x/src/add.ts
  vitest:coverage Uncovered files 1/2
  vitest:coverage File "/x/src/large-file.ts" is taking longer than 3s
  vitest:coverage 3027 ms /x/src/large-file.ts
  vitest:coverage Uncovered files 2/2
  vitest:coverage 4 ms /x/src/untested-file.ts
  vitest:coverage Generate coverage total time 3521 ms
此分析方法能有效偵測覆蓋率工具意外選取的大型檔案。 例如,如果您的設定意外地將大型且已縮小的 Javascript 建置檔案包含在程式碼覆蓋率中,它們應該會出現在日誌中。 在這些情況下,您可能需要調整 coverage.include 與 coverage.exclude 選項。
檢查效能分析記錄
您可以使用各種工具檢查 *.cpuprofile 與 *.heapprofile 的內容。請參閱以下清單以取得範例。