Debugging
TIP
When debugging tests you might want to use --test-timeout CLI argument to prevent tests from timing out when stopping at breakpoints.
VS Code
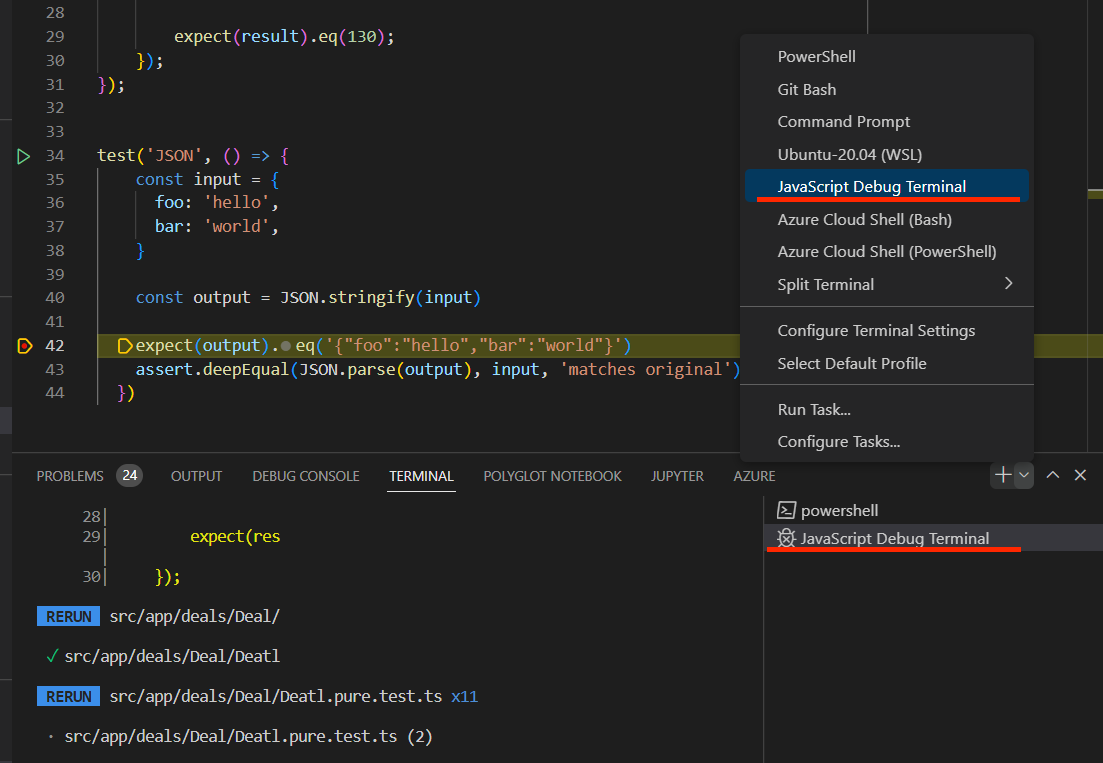
Quick way to debug tests in VS Code is via JavaScript Debug Terminal. Open a new JavaScript Debug Terminal and run npm run test or vitest directly. this works with any code run in Node, so will work with most JS testing frameworks
You can also add a dedicated launch configuration to debug a test file in VS Code:
{
  // For more information, visit: https://go.microsoft.com/fwlink/?linkid=830387
  "version": "0.2.0",
  "configurations": [
    {
      "type": "node",
      "request": "launch",
      "name": "Debug Current Test File",
      "autoAttachChildProcesses": true,
      "skipFiles": ["<node_internals>/**", "**/node_modules/**"],
      "program": "${workspaceRoot}/node_modules/vitest/vitest.mjs",
      "args": ["run", "${relativeFile}"],
      "smartStep": true,
      "console": "integratedTerminal"
    }
  ]
}
Then in the debug tab, ensure 'Debug Current Test File' is selected. You can then open the test file you want to debug and press F5 to start debugging.
Browser mode
To debug Vitest Browser Mode, pass --inspect or --inspect-brk in CLI or define it in your Vitest configuration:
vitest --inspect-brk --browser --no-file-parallelismimport { defineConfig } from 'vitest/config';
export default defineConfig({
test: {
inspectBrk: true,
fileParallelism: false,
browser: {
name: 'chromium',
provider: 'playwright',
},
},
});By default Vitest will use port 9229 as debugging port. You can overwrite it with by passing value in --inspect-brk:
vitest --inspect-brk=127.0.0.1:3000 --browser --no-file-parallelismUse following VSCode Compound configuration for launching Vitest and attaching debugger in the browser:
{
  "version": "0.2.0",
  "configurations": [
    {
      "type": "node",
      "request": "launch",
      "name": "Run Vitest Browser",
      "program": "${workspaceRoot}/node_modules/vitest/vitest.mjs",
      "console": "integratedTerminal",
      "args": ["--inspect-brk", "--browser", "--no-file-parallelism"]
    },
    {
      "type": "chrome",
      "request": "attach",
      "name": "Attach to Vitest Browser",
      "port": 9229
    }
  ],
  "compounds": [
    {
      "name": "Debug Vitest Browser",
      "configurations": ["Attach to Vitest Browser", "Run Vitest Browser"],
      "stopAll": true
    }
  ]
}
IntelliJ IDEA
Create a vitest run configuration. Use the following settings to run all tests in debug mode:
| Setting | Value |
|---|---|
| Working directory | /path/to/your-project-root |
Then run this configuration in debug mode. The IDE will stop at JS/TS breakpoints set in the editor.
Node Inspector, e.g. Chrome DevTools
Vitest also supports debugging tests without IDEs. However this requires that tests are not run parallel. Use one of the following commands to launch Vitest.
# To run in a single worker
vitest --inspect-brk --pool threads --poolOptions.threads.singleThread

# To run in a single child process
vitest --inspect-brk --pool forks --poolOptions.forks.singleFork

# To run in browser mode
vitest --inspect-brk --browser --no-file-parallelism
If you are using Vitest 1.1 or higher, you can also just provide --no-file-parallelism flag:
# If pool is unknown
vitest --inspect-brk --no-file-parallelism
Once Vitest starts it will stop execution and wait for you to open developer tools that can connect to Node.js inspector. You can use Chrome DevTools for this by opening chrome://inspect on browser.
In watch mode you can keep the debugger open during test re-runs by using the --poolOptions.threads.isolate false options.