テストパフォーマンスのプロファイリング
Vitest を実行すると、テストに関する複数の時間メトリクスが報告されます。
bashRUN v2.1.1 /x/vitest/examples/profiling ✓ test/prime-number.test.ts (1) 4517ms ✓ generate prime number 4517ms Test Files 1 passed (1) Tests 1 passed (1) Start at 09:32:53 Duration 4.80s (transform 44ms, setup 0ms, collect 35ms, tests 4.52s, environment 0ms, prepare 81ms) # Time metrics ^^
- Transform: ファイルの変換に要した時間。ファイル変換を参照してください。
- Setup:
setupFilesの実行に要した時間。 - Collect: テストファイル内のすべてのテストを収集するのに要した時間。これには、すべてのファイル依存関係のインポート時間も含まれます。
- Tests: 実際のテストケースの実行に要した時間。
- Environment: テスト
environment(例:JSDOM)のセットアップに要した時間。 - Prepare: Vitest がテストランナーを準備するために要する時間。
テストランナー
テストの実行時間が長い場合は、テストランナーのプロファイルを生成できます。以下のオプションについては、Node.js のドキュメントを参照してください。
WARNING
--prof オプションは、node:worker_threads の制限により pool: 'threads' では動作しません。
これらのオプションを Vitest のテストランナーに渡すには、Vitest の設定で poolOptions.<pool>.execArgv を定義します。
import { defineConfig } from 'vitest/config';

export default defineConfig({
  test: {
    pool: 'forks',
    poolOptions: {
      forks: {
        execArgv: [
          '--cpu-prof',
          '--cpu-prof-dir=test-runner-profile',
          '--heap-prof',
          '--heap-prof-dir=test-runner-profile',
        ],

        // 単一のプロファイルを生成するには
        singleFork: true,
      },
    },
  },
});import { defineConfig } from 'vitest/config';
export default defineConfig({
test: {
pool: 'threads',
poolOptions: {
threads: {
execArgv: [
'--cpu-prof',
'--cpu-prof-dir=test-runner-profile',
'--heap-prof',
'--heap-prof-dir=test-runner-profile',
],
// 単一のプロファイルを生成するには
singleThread: true,
},
},
},
});テスト実行後、test-runner-profile/*.cpuprofile および test-runner-profile/*.heapprofile ファイルが生成されます。これらのファイルを分析する方法については、プロファイリングレコードの検査を参照してください。
例については、Profiling | Examples を参照してください。
メインスレッド
メインスレッドのプロファイリングは、Vitest の Vite 使用状況と globalSetup ファイルのデバッグに役立ちます。 Vite プラグインもこのスレッドで実行されます。
TIP
Vite 固有のプロファイリングに関するその他のヒントについては、Performance | Vite を参照してください。
Vite プラグインのパフォーマンスをプロファイリングするには、vite-plugin-inspect をお勧めします。
これを行うには、Vitest を実行する Node プロセスに引数を渡す必要があります。
$ node --cpu-prof --cpu-prof-dir=main-profile ./node_modules/vitest/vitest.mjs --run
#      ^^^^^^^^^^^^^^^^^^^^^^^^^^^^^^^^^^^^^^                                  ^^^^^
# Node.js の引数 Vitest の引数テスト実行後、main-profile/*.cpuprofile ファイルが生成されます。これらのファイルを分析する方法については、プロファイリングレコードの検査を参照してください。
ファイル変換
テストファイルの変換と収集に時間がかかる場合は、DEBUG=vite-node:* 環境変数を使用して、どのファイルが vite-node によって変換および実行されているかを確認できます。
$ DEBUG=vite-node:* vitest --run

 RUN  v2.1.1 /x/vitest/examples/profiling

  vite-node:server:request /x/vitest/examples/profiling/global-setup.ts +0ms
  vite-node:client:execute /x/vitest/examples/profiling/global-setup.ts +0ms
  vite-node:server:request /x/vitest/examples/profiling/test/prime-number.test.ts +45ms
  vite-node:client:execute /x/vitest/examples/profiling/test/prime-number.test.ts +26ms
  vite-node:server:request /src/prime-number.ts +9ms
  vite-node:client:execute /x/vitest/examples/profiling/src/prime-number.ts +9ms
  vite-node:server:request /src/unnecessary-file.ts +6ms
  vite-node:client:execute /x/vitest/examples/profiling/src/unnecessary-file.ts +4ms
...このプロファイリング戦略は、バレルファイルによって引き起こされる不要な変換を特定するのに役立ちます。 これらのログに、テスト実行時に読み込まれるべきでないファイルが含まれている場合、不要なファイルをインポートしているバレルファイルがある可能性があります。
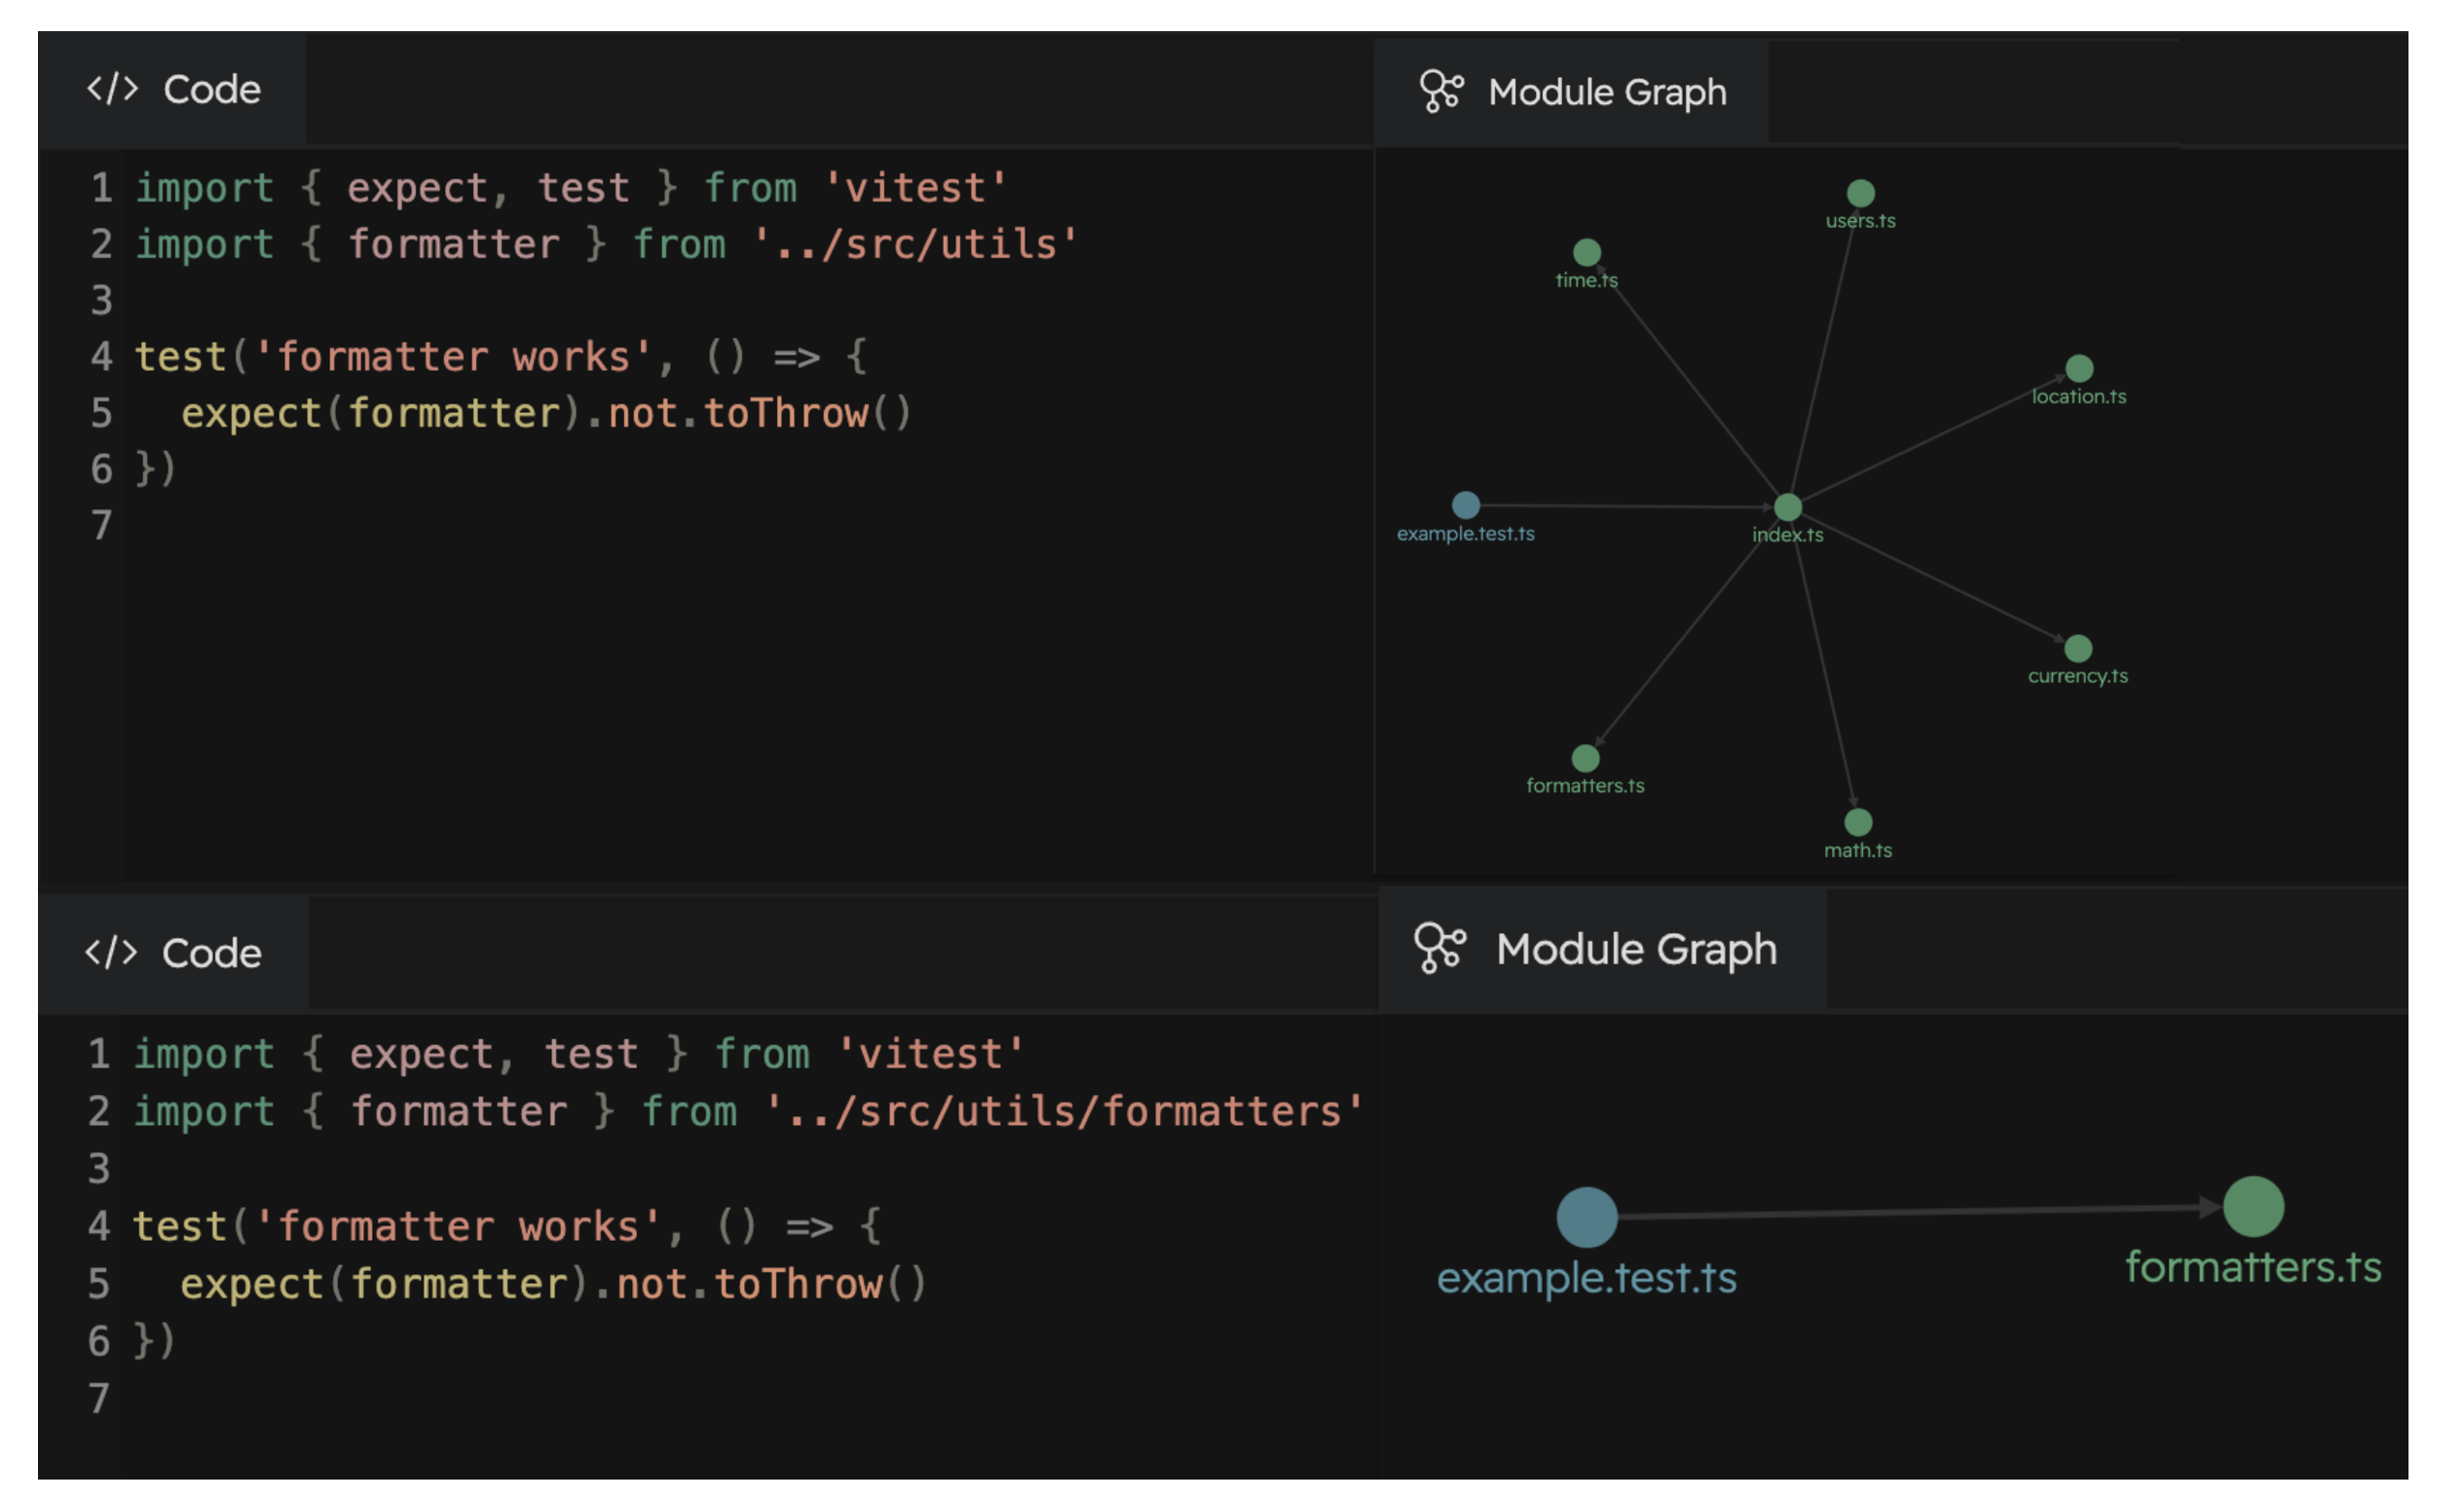
Vitest UI を使用して、バレルファイルによって引き起こされる遅延をデバッグすることもできます。 以下の例は、バレルファイルなしでファイルをインポートすると、変換対象ファイル数が約 85% 削減されることを示しています。
├── src
│   └── utils
│       ├── currency.ts
│       ├── formatters.ts  <-- テスト対象ファイル
│       ├── index.ts
│       ├── location.ts
│       ├── math.ts
│       ├── time.ts
│       └── users.ts
├── test
│   └── formatters.test.ts
└── vitest.config.tsimport { expect, test } from 'vitest';
import { formatter } from '../src/utils';
import { formatter } from '../src/utils/formatters';
test('formatter works', () => {
expect(formatter).not.toThrow();
});
ファイルがどのように変換されるかを確認するには、VITE_NODE_DEBUG_DUMP 環境変数を使用して、変換されたファイルをファイルシステムに書き込むことができます。
$ VITE_NODE_DEBUG_DUMP=true vitest --run

[vite-node] [debug] dump modules to /x/examples/profiling/.vite-node/dump

 RUN  v2.1.1 /x/vitest/examples/profiling
...

$ ls .vite-node/dump/
_x_examples_profiling_global-setup_ts-1292904907.js
_x_examples_profiling_test_prime-number_test_ts-1413378098.js
_src_prime-number_ts-525172412.js
プロファイリングレコードの検査
*.cpuprofile および *.heapprofile の内容は、さまざまなツールで検査できます。例については、以下のリストを参照してください。