分析测试性能
运行 Vitest 时,它会报告多项测试时间指标:
bashRUN v2.1.1 /x/vitest/examples/profiling ✓ test/prime-number.test.ts (1) 4517ms ✓ generate prime number 4517ms Test Files 1 passed (1) Tests 1 passed (1) Start at 09:32:53 Duration 4.80s (transform 44ms, setup 0ms, collect 35ms, tests 4.52s, environment 0ms, prepare 81ms) # 时间指标 ^^
- Transform:转换文件所花费的时间。详见文件转换。
- Setup:运行
setupFiles文件所花费的时间。 - Collect:收集测试文件中所有测试所花费的时间,包括导入所有文件依赖项的时间。
- Tests:实际运行测试用例所花费的时间。
- Environment:设置测试
environment(例如 JSDOM)所花费的时间。 - Prepare:Vitest 用于准备测试运行器的时间。
测试运行器
如果测试执行时间较长,你可以生成测试运行器的性能分析文件。以下选项请参考 NodeJS 文档:
WARNING
由于 node:worker_threads 的限制,--prof 选项不适用于 pool: 'threads'。
要将这些选项传递给 Vitest 的测试运行器,请在 Vitest 配置中定义 poolOptions.<pool>.execArgv:
import { defineConfig } from 'vitest/config';

export default defineConfig({
  test: {
    pool: 'forks',
    poolOptions: {
      forks: {
        execArgv: [
          '--cpu-prof',
          '--cpu-prof-dir=test-runner-profile',
          '--heap-prof',
          '--heap-prof-dir=test-runner-profile',
        ],

        // To generate a single profile
        singleFork: true,
      },
    },
  },
});import { defineConfig } from 'vitest/config';
export default defineConfig({
test: {
pool: 'threads',
poolOptions: {
threads: {
execArgv: [
'--cpu-prof',
'--cpu-prof-dir=test-runner-profile',
'--heap-prof',
'--heap-prof-dir=test-runner-profile',
],
// To generate a single profile
singleThread: true,
},
},
},
});测试运行后,将生成 test-runner-profile/*.cpuprofile 和 test-runner-profile/*.heapprofile 文件。有关如何分析这些文件的说明,请参阅检查性能分析记录。
有关示例,请参阅性能分析示例。
主线程
主线程性能分析有助于调试 Vitest 对 Vite 的使用情况以及 globalSetup 文件。 Vite 插件也在此线程中运行。
为此,你需要将参数传递给运行 Vitest 的 Node 进程。
$ node --cpu-prof --cpu-prof-dir=main-profile ./node_modules/vitest/vitest.mjs --run
#      ^^^^^^^^^^^^^^^^^^^^^^^^^^^^^^^^^^^^^^                                  ^^^^^
#               NodeJS 参数                                           Vitest 参数
测试运行后,将生成 main-profile/*.cpuprofile 文件。有关如何分析这些文件的说明,请参阅检查性能分析记录。
文件转换
如果测试转换和收集耗时较长,你可以使用 DEBUG=vite-node:* 环境变量来查看 vite-node 正在转换和执行哪些文件。
$ DEBUG=vite-node:* vitest --run

 RUN  v2.1.1 /x/vitest/examples/profiling

  vite-node:server:request /x/vitest/examples/profiling/global-setup.ts +0ms
  vite-node:client:execute /x/vitest/examples/profiling/global-setup.ts +0ms
  vite-node:server:request /x/vitest/examples/profiling/test/prime-number.test.ts +45ms
  vite-node:client:execute /x/vitest/examples/profiling/test/prime-number.test.ts +26ms
  vite-node:server:request /src/prime-number.ts +9ms
  vite-node:client:execute /x/vitest/examples/profiling/src/prime-number.ts +9ms
  vite-node:server:request /src/unnecessary-file.ts +6ms
  vite-node:client:execute /x/vitest/examples/profiling/src/unnecessary-file.ts +4ms
...
这种性能分析策略是识别由 barrel files 引起的不必要转换的有效方法。 如果这些日志包含测试运行时不应加载的文件,则你的 barrel files 可能存在不必要的导入。
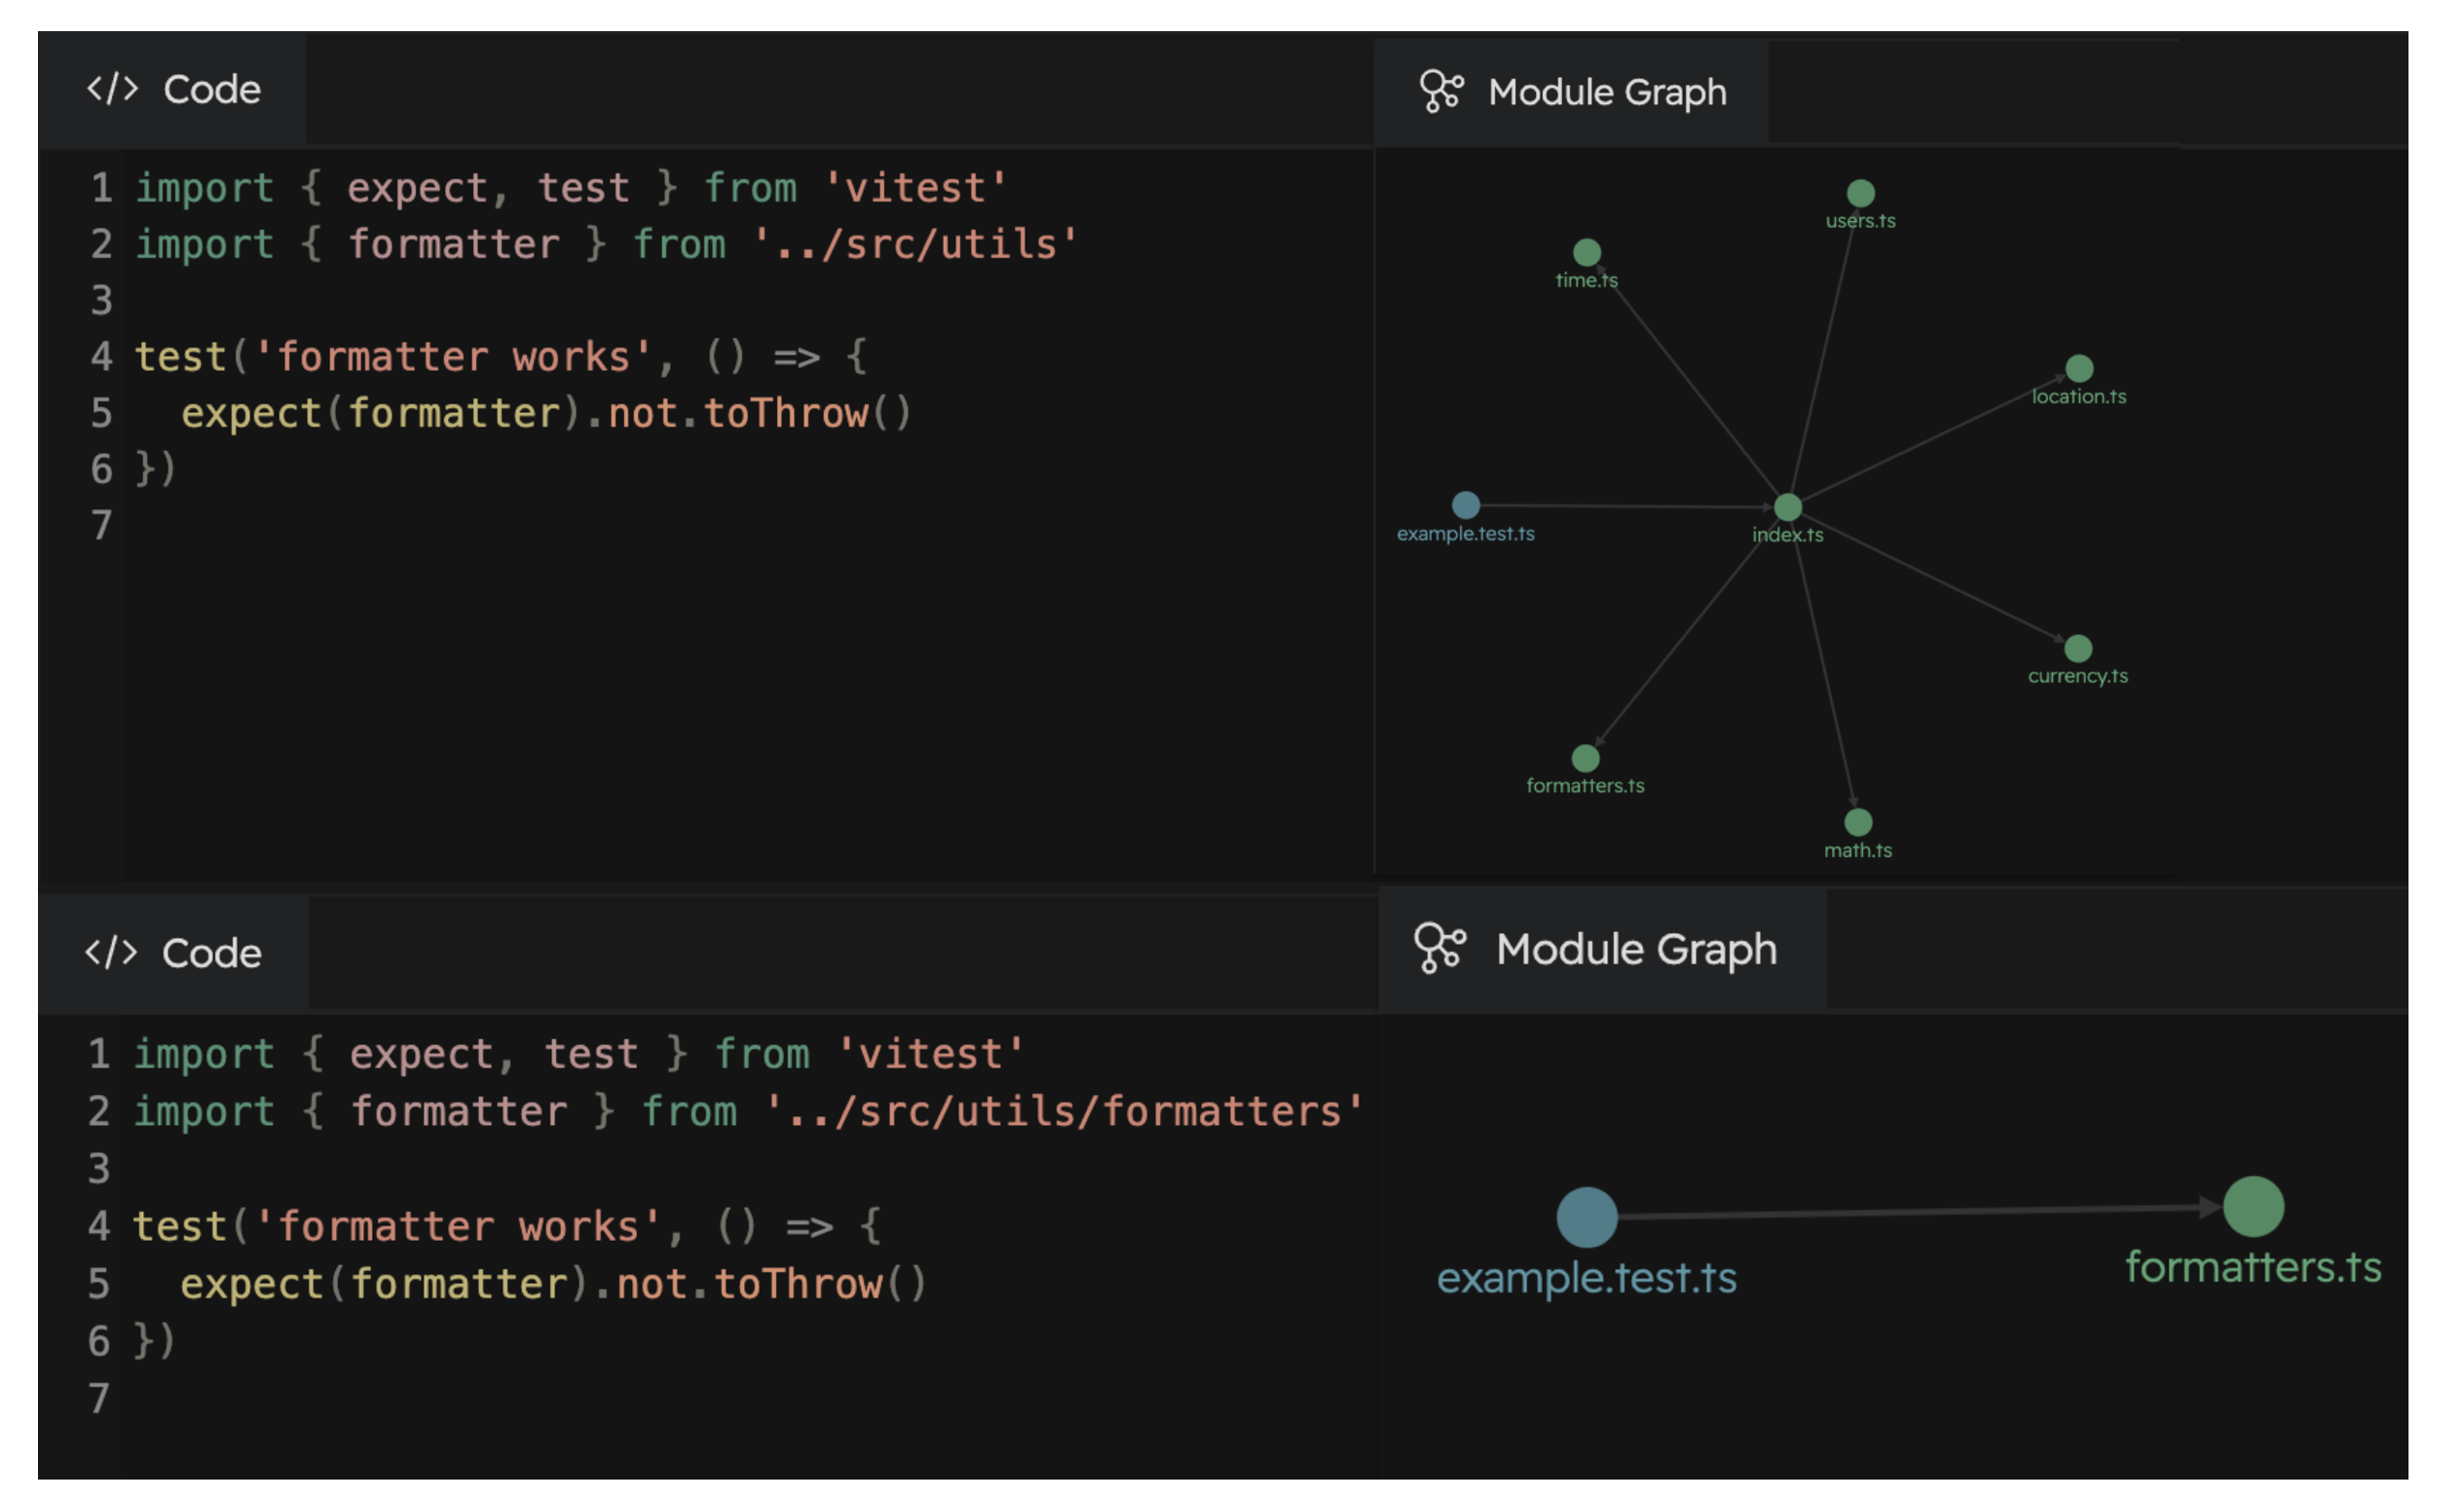
你还可以使用 Vitest UI 来调试由 barrel file 引起的性能问题。 如下示例展示了在不使用 barrel file 的情况下,导入文件如何将转换的文件数量减少约 85%。
├── src
│   └── utils
│       ├── currency.ts
│       ├── formatters.ts  <-- File to test
│       ├── index.ts
│       ├── location.ts
│       ├── math.ts
│       ├── time.ts
│       └── users.ts
├── test
│   └── formatters.test.ts
└── vitest.config.tsimport { expect, test } from 'vitest';
import { formatter } from '../src/utils';
import { formatter } from '../src/utils/formatters';
test('formatter works', () => {
expect(formatter).not.toThrow();
});
要查看文件转换过程,你可以使用 VITE_NODE_DEBUG_DUMP 环境变量将转换后的文件写入文件系统:
$ VITE_NODE_DEBUG_DUMP=true vitest --run

[vite-node] [debug] dump modules to /x/examples/profiling/.vite-node/dump

 RUN  v2.1.1 /x/vitest/examples/profiling
...

$ ls .vite-node/dump/
_x_examples_profiling_global-setup_ts-1292904907.js
_x_examples_profiling_test_prime-number_test_ts-1413378098.js
_src_prime-number_ts-525172412.js
检查性能分析记录
可使用多种工具检查 *.cpuprofile 和 *.heapprofile 文件的内容。示例如下: