Skip to content
Material Design 2
Main Navigation
v3
v2
v1

English

简体中文
繁體中文
Español
Français
Русский
Português – Brasil
Deutsch
日本語
한국어
Italiano
Polski
Türkçe
čeština
magyar

English

简体中文
繁體中文
Español
Français
Русский
Português – Brasil
Deutsch
日本語
한국어
Italiano
Polski
Türkçe
čeština
magyar

Appearance

Sidebar Navigation

Material System

Introduction

Material studies

About our Material studies

Basil

Crane

Fortnightly

Owl

Rally

Reply

Shrine

Material Foundation

Environment

Surfaces

Elevation

Light and shadows

Layout

Understanding layout

Pixel density

Responsive layout grid

Spacing methods

Component behavior

Applying density

Navigation

Understanding navigation

Navigation transitions

Search

Color

The color system

Applying color to UI

Color usage

Text legibility

Dark theme

Typography

The type system

Understanding typography

Language support

Sound

About sound

Applying sound to UI

Sound attributes

Sound choreography

Iconography

Product icons

System icons

Animated icons

Shape

About shape

Shape and hierarchy

Shape as expression

Shape and motion

Applying shape to UI

Motion

Understanding motion

The motion system

Speed

Choreography

Customization

Interaction

Gestures

Selection

States

Communication

Confirmation & acknowledgement

Data formats

Data visualization

Empty states

Help & feedback

Imagery

Launch screen

Onboarding

Offline states

Writing

Machine learning

Machine learning patterns

Object detection: live camera

Object detection: static image

Barcode Scanning

Material Guidelines

Material Theming

Overview

Implementing your theme

Usability

Accessibility

Bidirectionality

Platform guidance

Android bars

Android fingerprint

Android haptics

Android icons

Android navigating between apps

Android notifications

Android permissions

Android slices

Android split-screen

Android swipe-to-refresh

Android text selection toolbar

Android widget

Cross-platform adaptation

Components

App bars: bottom

App bars: top

Backdrop

Banners

Bottom navigation

Buttons

Buttons: floating action button

Cards

Checkboxes

Chips

Data tables

Date pickers

Dialogs

Dividers

Image lists

Lists

Menus

Navigation drawer

Navigation rail

Progress indicators

Radio buttons

Sheets: bottom

Sheets: side

Sliders

Snackbars

Switches

Tabs

Text fields

Time pickers

Tooltips

On this page

Data tables ​

Data tables display sets of data across rows and columns.

Interactive demo ​

This demo lets you preview the data table component and its configuration options.

Usage ​

Data tables display information in a grid-like format of rows and columns. They organize information in a way that’s easy to scan so that users can look for patterns and develop insights from data.

Data tables can contain:

  • Interactive components (such as chips, buttons, or menus)
  • Non-interactive elements (such as badges)
  • Tools to query and manipulate data

Principles ​

Data table principle: organized

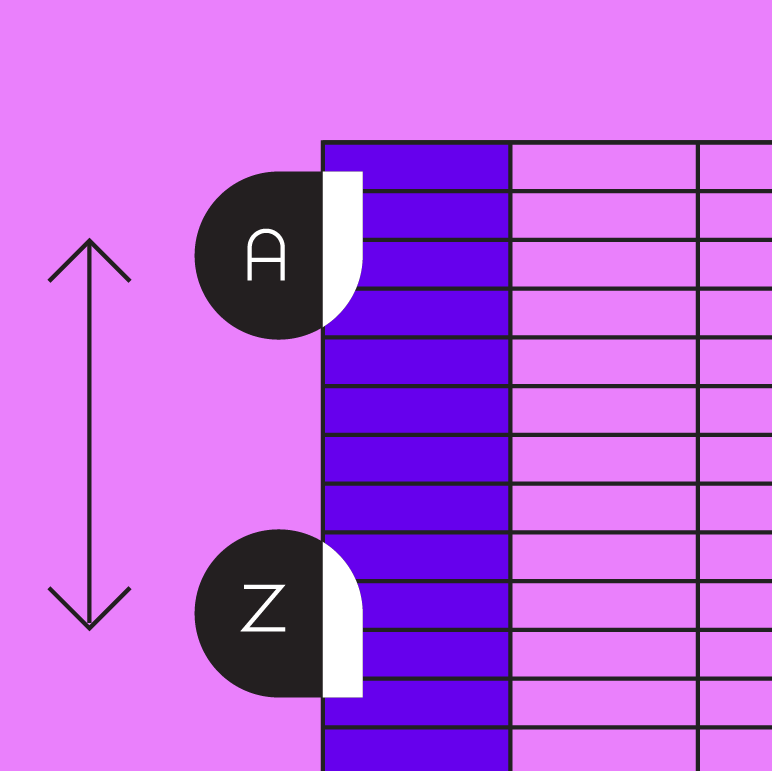
Organized

Information should be organized in a meaningful way, such as hierarchy or alphabetization.
Data table principle: interactive

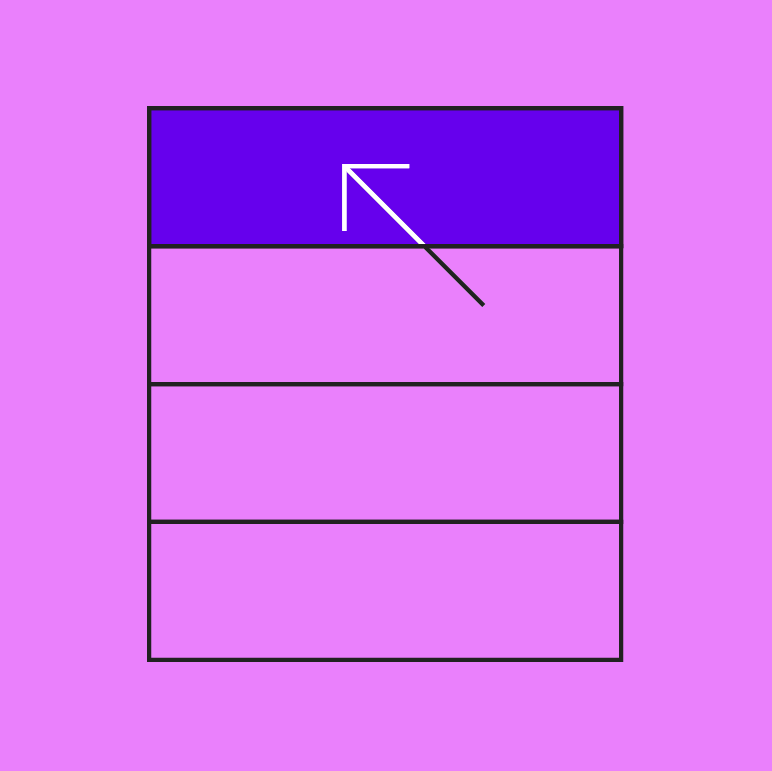
Interactive

Data tables should allow user interaction so that a data display is customizable and interactive.
Data table principle: intuitive

Intuitive

Data tables should be easy to use, with a logical structure that makes content easy to understand.

Anatomy ​
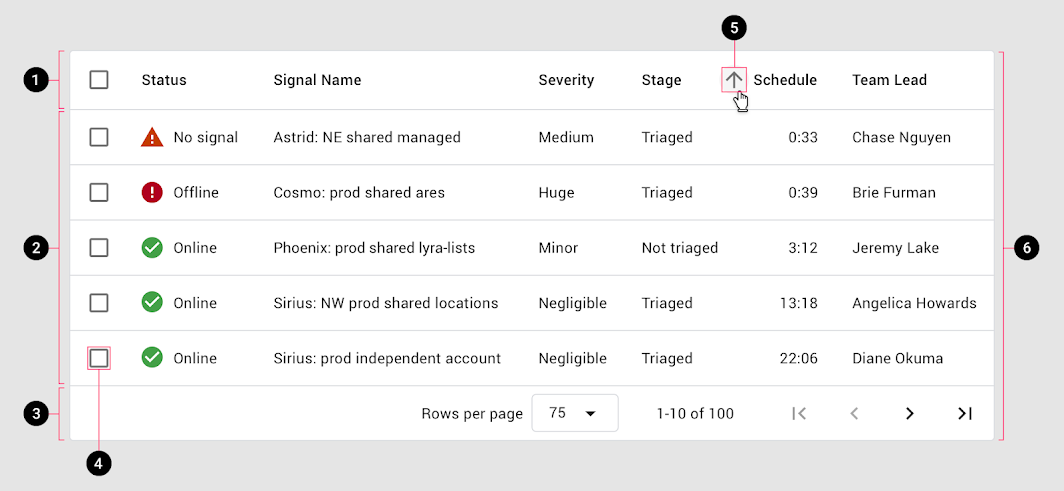
Diagram of header row, rows, pagination, row checkbox, sort button, container
1. Header row
2. Rows
3. Pagination
4. Row checkbox
5. Sort button
6. Container

Data table elements ​

Baseline elements ​

Column header names describe the type of content displayed in each column. Each row contains data related to a single entity.

Interactive elements ​

Data tables can include interactive elements, such as:

  • Checkboxes
  • Sorting (on columns)
  • Icons that communicate alerts
  • Pagination

Pagination or filter chips: Controls that manipulate how table data is displayed should be placed directly above or below a table.
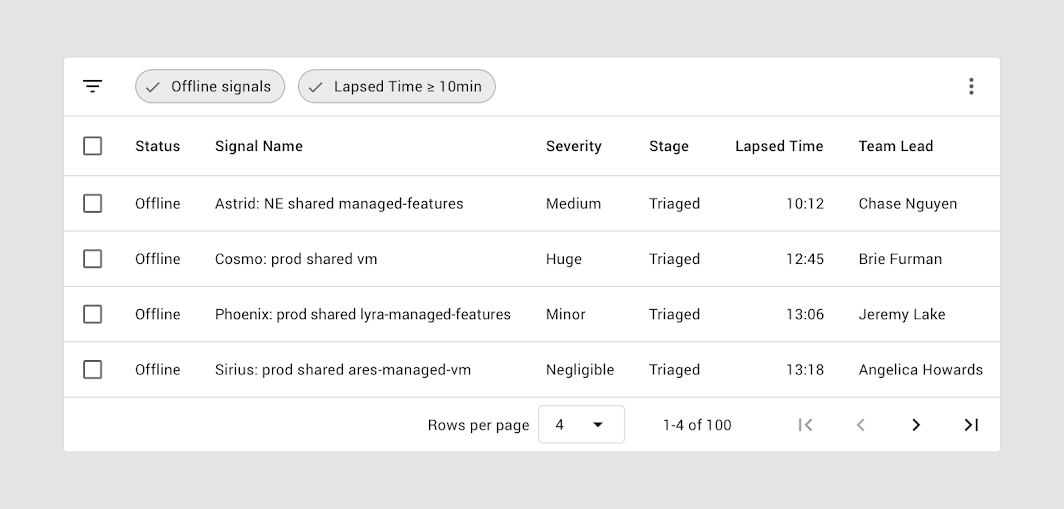
Above the header row, a filter bar shows two active filters
Above the header row, a filter bar shows two active filters. Pagination is shown below the bottom row.

Columns ​

Height and padding ​

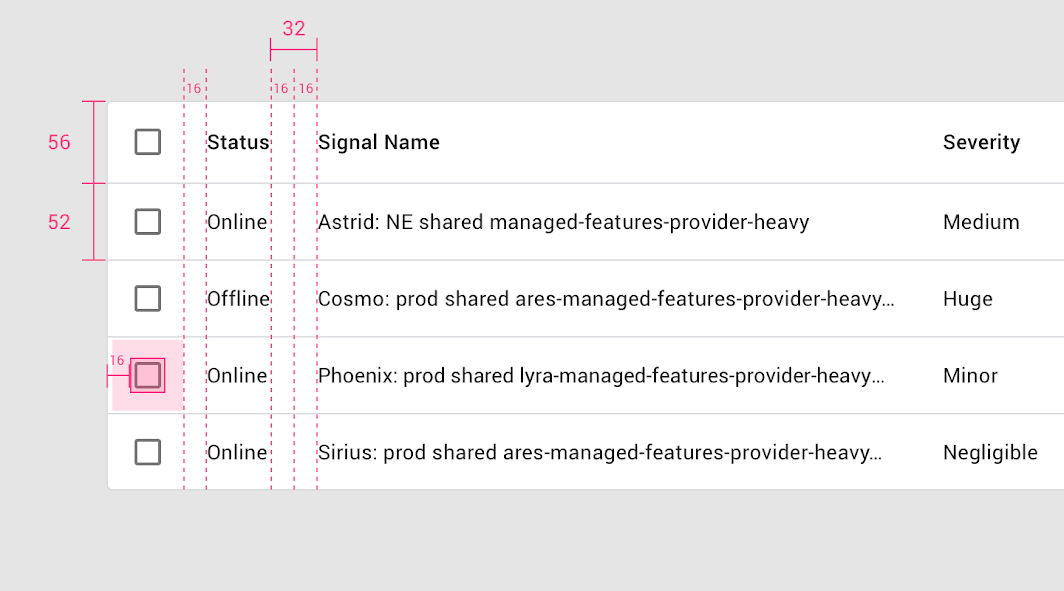
The baseline row height is 52dp, and the column header row height is 56dp (4dp taller than regular rows).
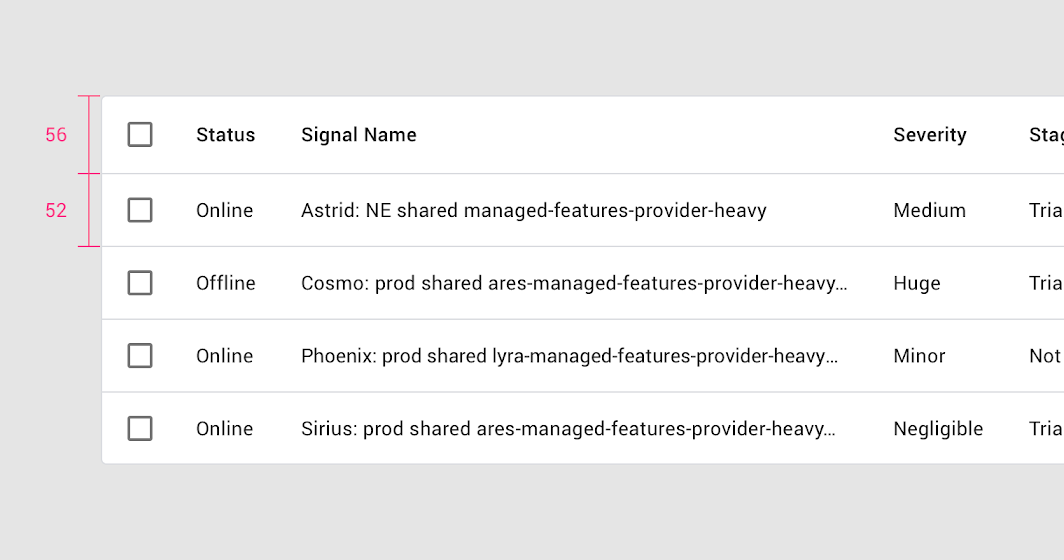
Height and padding: columns anatomy

Padding ​

There is 32dp or more of padding between columns.
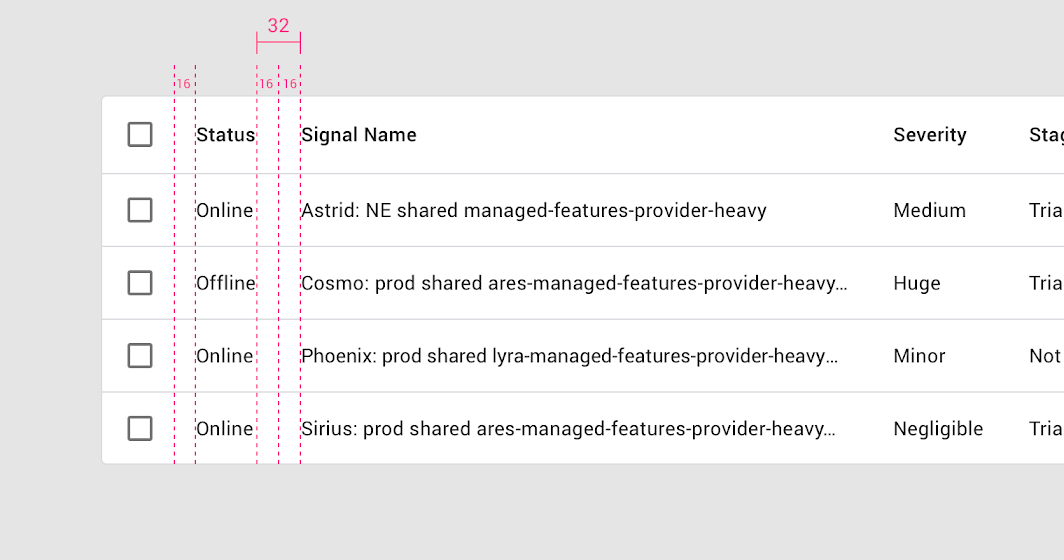
There is 16dp padding on the left and right side of each header name
There is 16dp padding on the left and right side of each header name.

Text ​

Column header text uses a medium weight font to differentiate from row text.

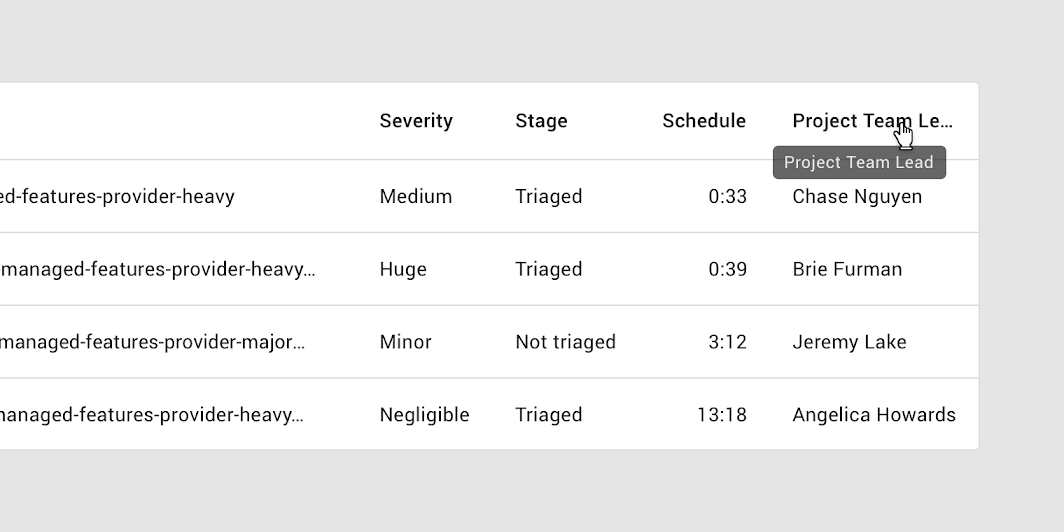
Text that is longer than the column width is truncated with an ellipsis. On hover, a tooltip shows the full name.
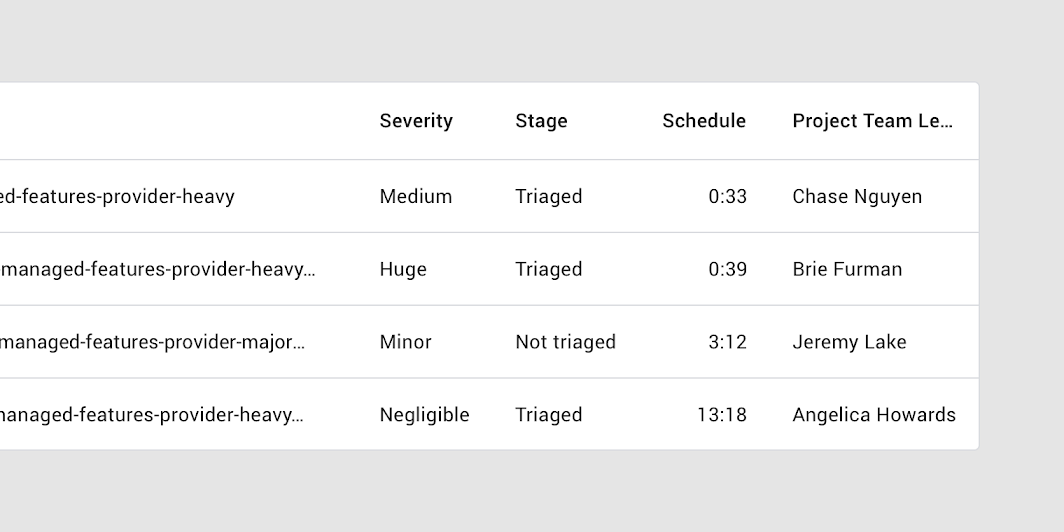
Long column headers are truncated with an ellipsis
Long column headers are truncated with an ellipsis.

Hovering over a truncated column header reveals a tooltip that displays the full text
Hovering over a truncated column header reveals a tooltip that displays the full text.

Sorting ​

To help users sort information, column can be displayed sorting by default.

To indicate which column is sorted by default, place a downward or upward arrow icon next to the column header’s name.
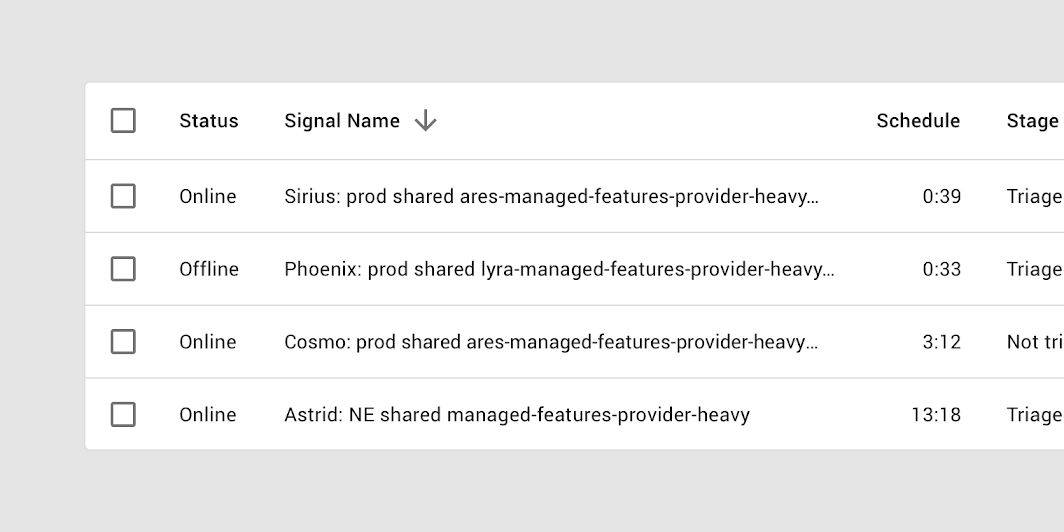
Sorting by signal name in descending order is indicated with a downward arrow next to the column header name
Sorting by signal name in descending order is indicated with a downward arrow next to the column header name.

Reversing sort order ​

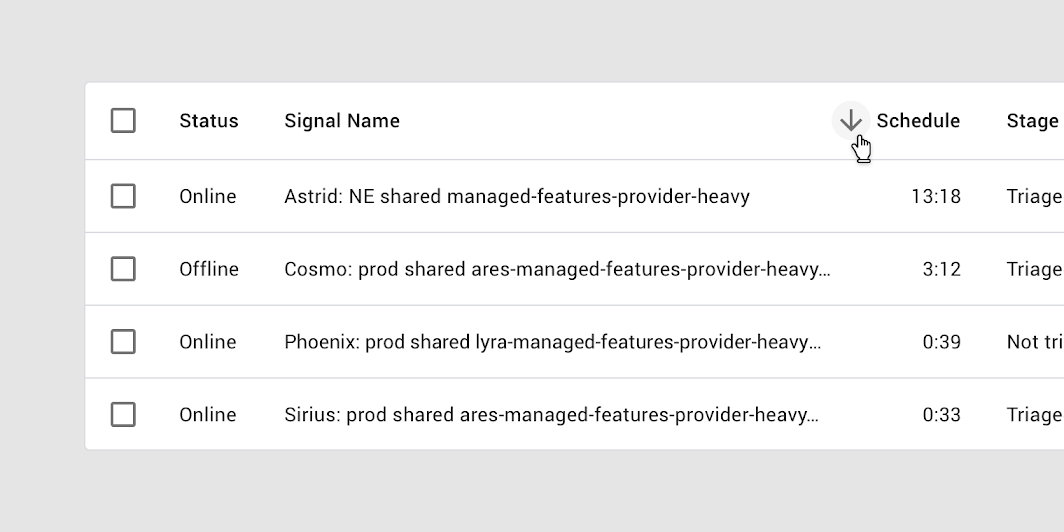
To reverse the sort order of a column, a user taps the header name or arrow icon. Upon sorting, the arrow icon reverses direction.
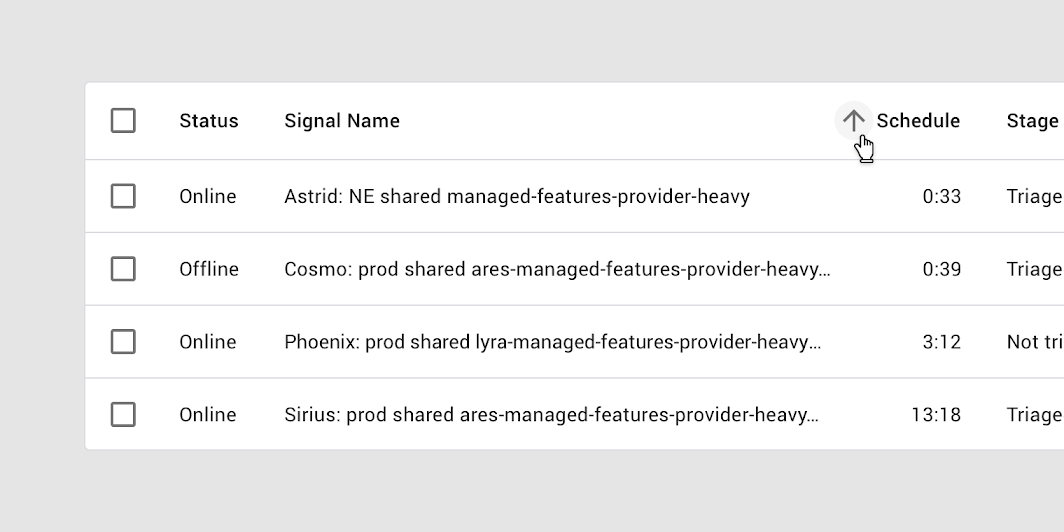
Sorting by the schedule column in ascending order is indicated with an upward arrow
Sorting by the schedule column in ascending order is indicated with an upward arrow.

A table sorted in reverse: the downward arrow shows that the schedule column is sorted in descending order
A table sorted in reverse: the downward arrow shows that the schedule column is sorted in descending order.

Sorting with a progress indicator ​

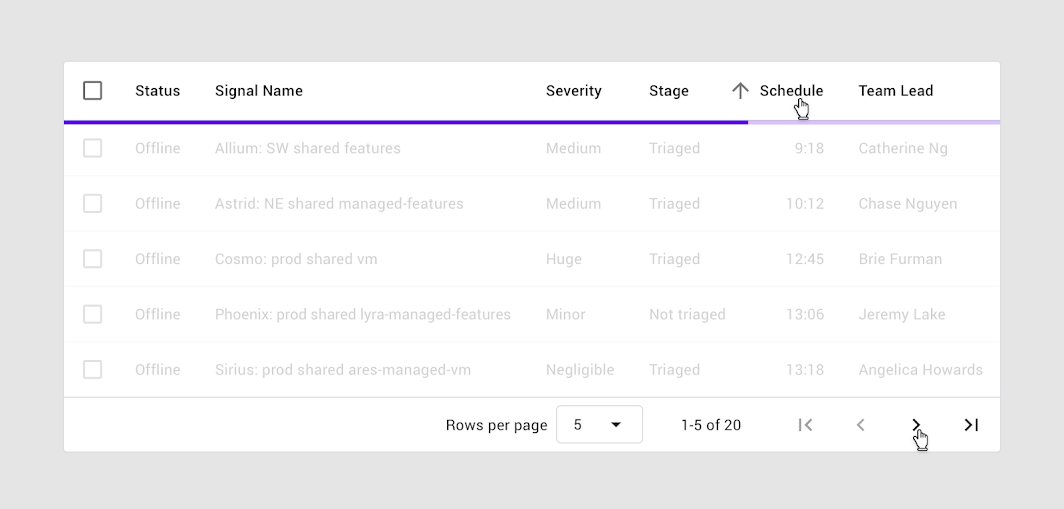
A linear progress indicator is used in data tables when sorting is initiated. The progress indicator communicates to users that sorting is in process.
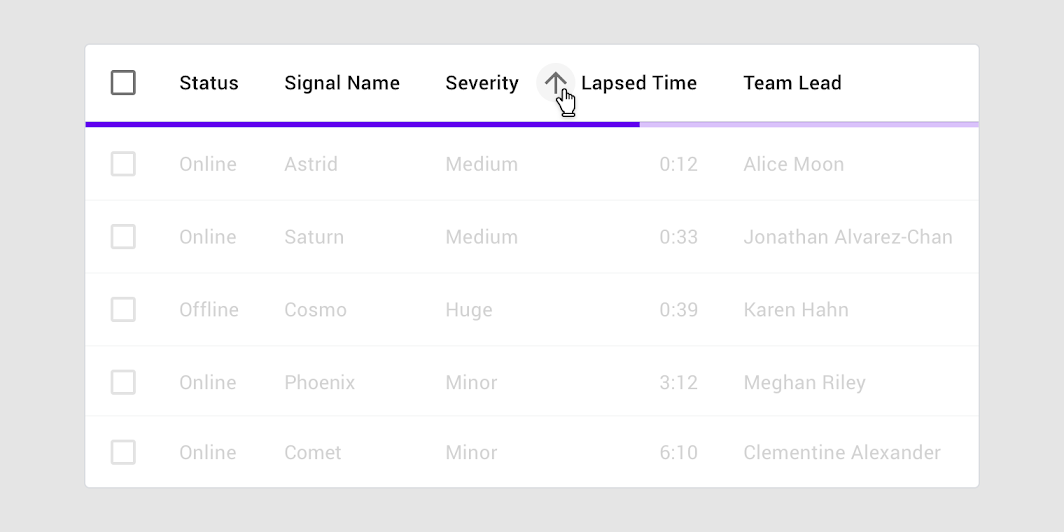
A linear progress indicator signals that sorting is in process
A linear progress indicator signals that sorting is in process.

Row checkbox ​

When a row checkbox is selected, the row should display a background color.

For people who use screen magnification, the selected checkbox may appear outside of the magnified screen area. The addition of a background color fill provides an additional way to indicate that a row has been selected.

For more information on selection states, visit States.
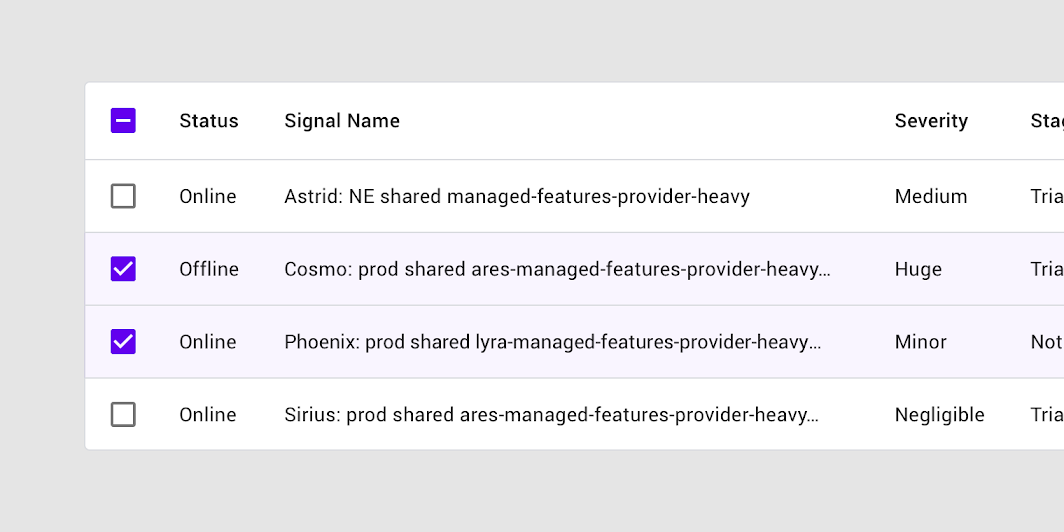
A selected row checkbox with background color fill on the entire row
A selected row checkbox with background color fill on the entire row.

Behavior ​

Row hover (Desktop) ​

When a user hovers over a row, that row displays a background color.
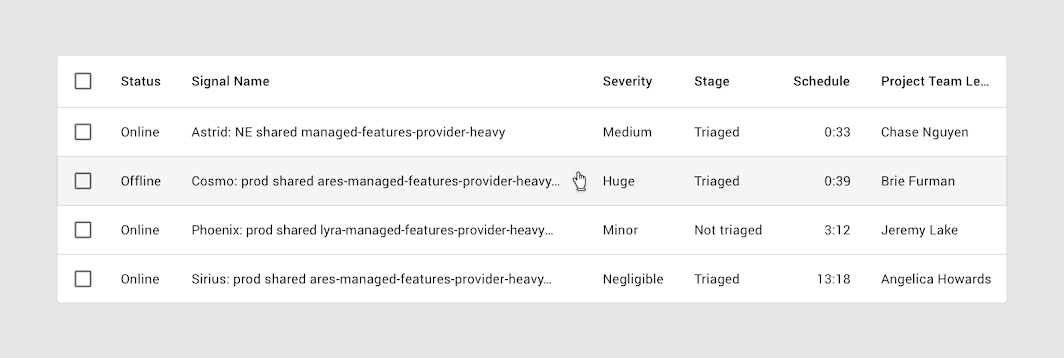
A row that displays a background color on hover
A row that displays a background color on hover.

Column hover (Desktop) ​

When the user hovers over a column header:

  • A tooltip can display the full column name (if it’s truncated) or a more detailed description of the column
  • If sorting is enabled, an arrow icon can appear next to the column header
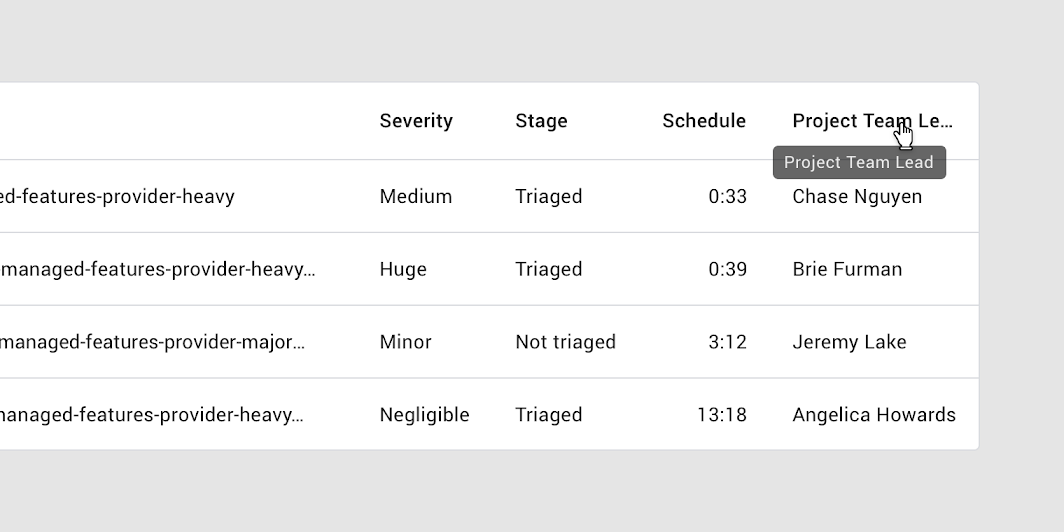
A tooltip or a downward or upward arrow icon can be displayed when hovering over a column name
A tooltip or a downward or upward arrow icon can be displayed when hovering over a column name. Two cursors are displayed for demonstration purposes.

Focus ​

When using keyboard focus, an indicator appears as users tab through interactive items such as checkboxes.
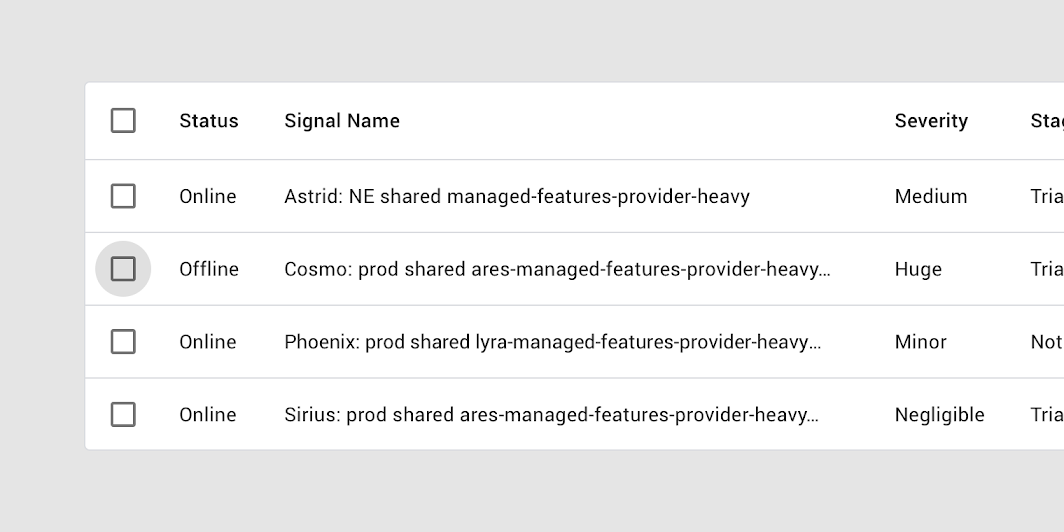
Keyboard focus on the checkbox

Inline menus ​

Inline menus allow selection from a predefined set of menu items. They're embedded directly in a table cell.
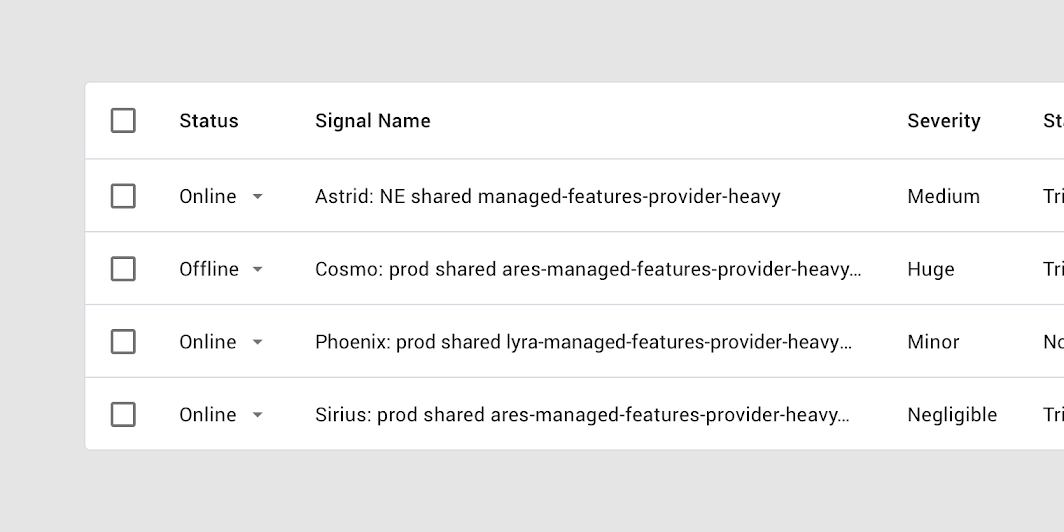
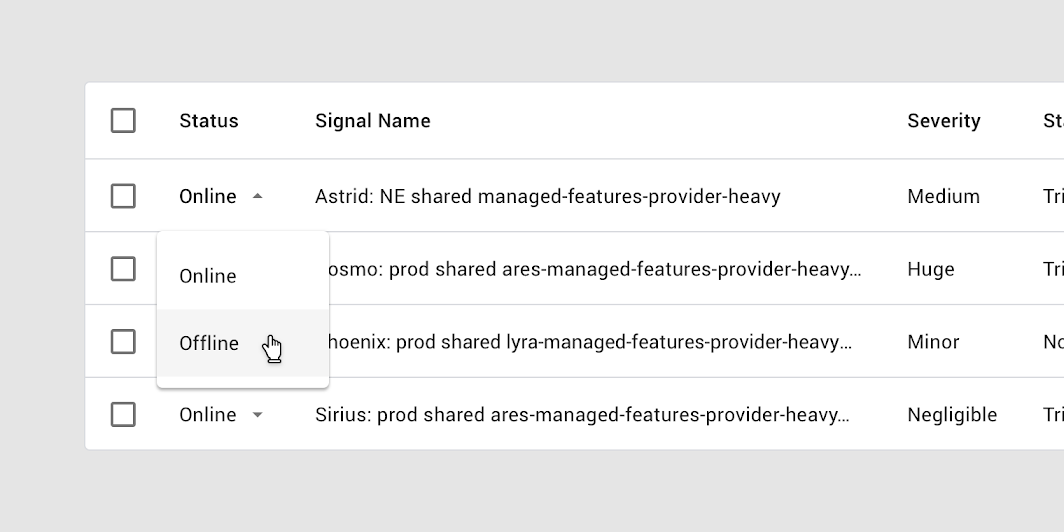
A table with inline menus

An expanded inline menu

Menus

Menus display a list of choices on temporary surfaces.

Related article

Pagination ​

Pagination controls provide swift access to all pages while indicating that more pages exist.

Pagination controls display:

  • Number of rows per page
  • Total number of rows, including the range currently in view
  • Left and right arrows for navigating pages

Placement ​

Pagination is placed at the bottom of a table.
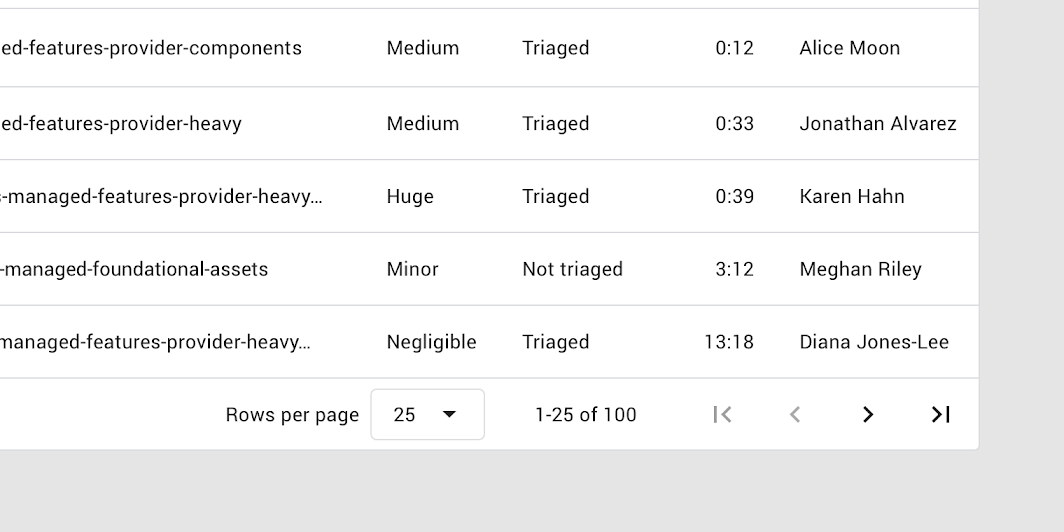
25 rows per page are displayed, with a total of 100 rows
25 rows per page are displayed, with a total of 100 rows.

Pagination menus show a predefined list of options for the quantity of rows to display.
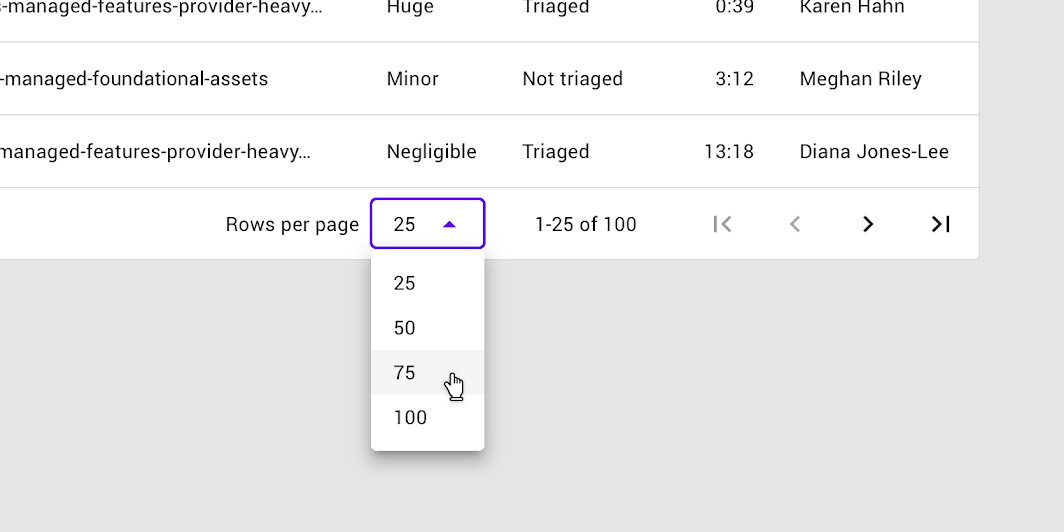
Dropdown menus are used in the pagination section of the table to allow selection of rows-per-page
Dropdown menus are used in the pagination section of the table to allow selection of rows-per-page.

A progress indicator can be used with sorting or pagination
A progress indicator can be used with sorting or pagination. Two cursors are displayed for demonstration purposes.

Theming ​

Rally Material Theme ​

The Rally personal finance app’s data tables have been customized using Material Theming. The areas of customization include color, typography, and shape.
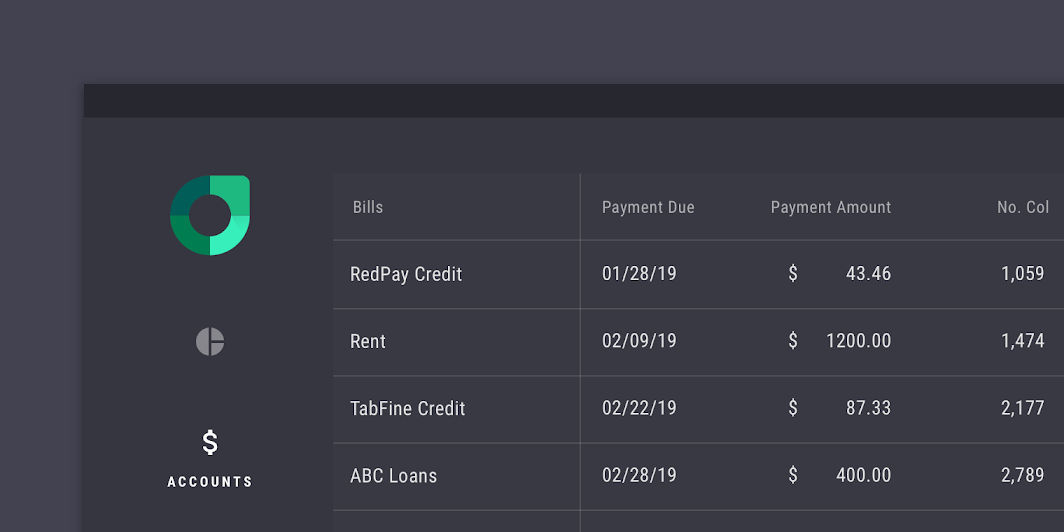
Rally’s customized data tables

Rally

Rally is a personal finance app that demonstrates how Material Design can be used for finance.

Related article

The color system

Create a color theme that reflects your brand or style

Related article

Applying color to UI

In a UI, color has a variety of roles: from containing meaning, to expressing a look and feel.

Related article

Color ​

Rally’s data tables use custom color on four elements: the container, table text, header text, and dividers.
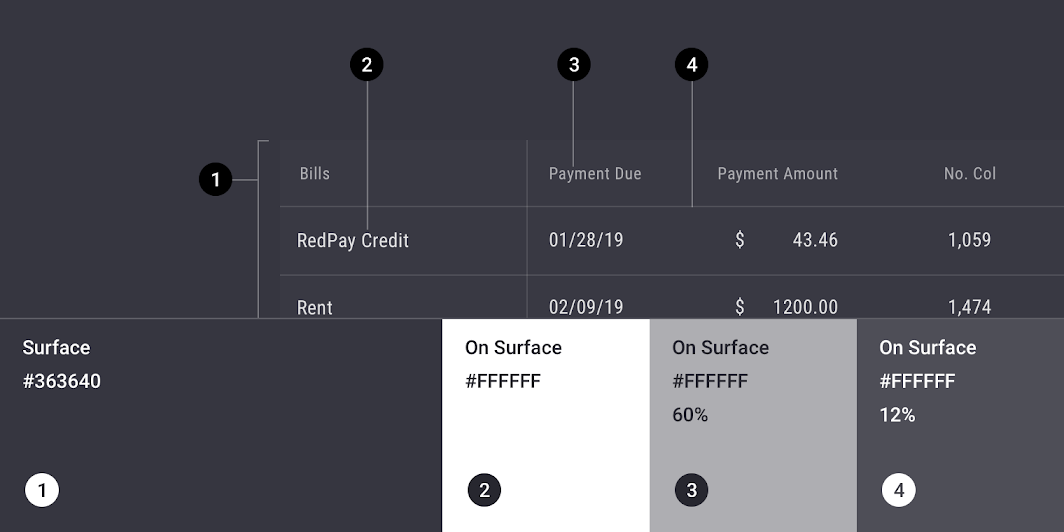
Rally Material theme: color
ElementCategoryAttributeValue
ContainerSurfaceColor
Opacity
#3C3C46
100%
Table textOn SurfaceColor
Opacity
#FFFFFF
100%
Header textOn SurfaceColor
Opacity
#FFFFFF
60%
DividerOn SurfaceColor
Opacity
#FFFFFF
12%

Understanding typography

Typography is critical in establishing hierarchy and expressing brand presence that supports an effective digital experience.

Related article

Typography ​

Rally’s data tables use custom typography for table text.
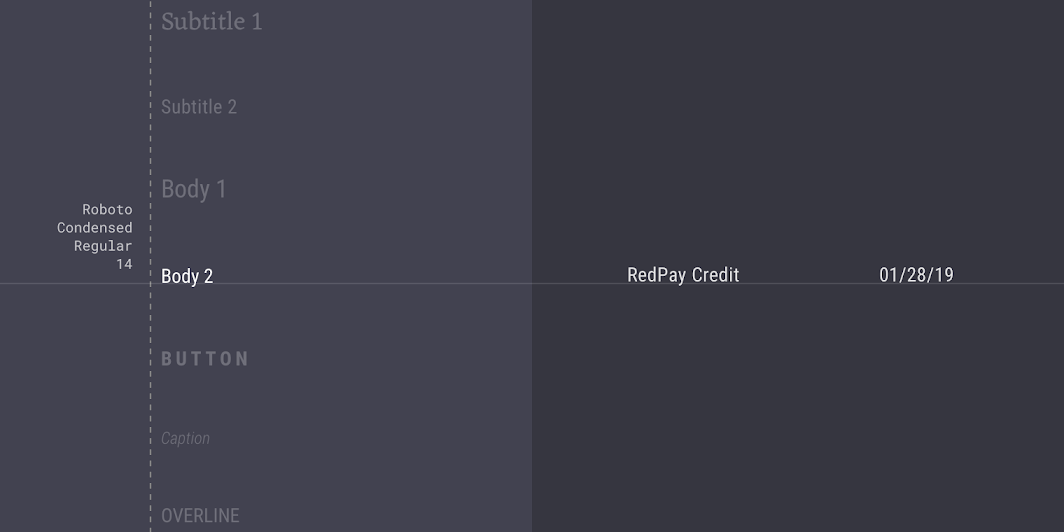
Rally Material theme: typography
ElementCategoryAttributeValue
TextBody 2Typeface
Font
Size
Case
Roboto Condensed
Regular
14
Title case

About shape

Direct attention, identify components, communicate state, and express brand

Related link

Shape ​

Rally’s data tables have custom corner shapes, with 0dp long cut corners.
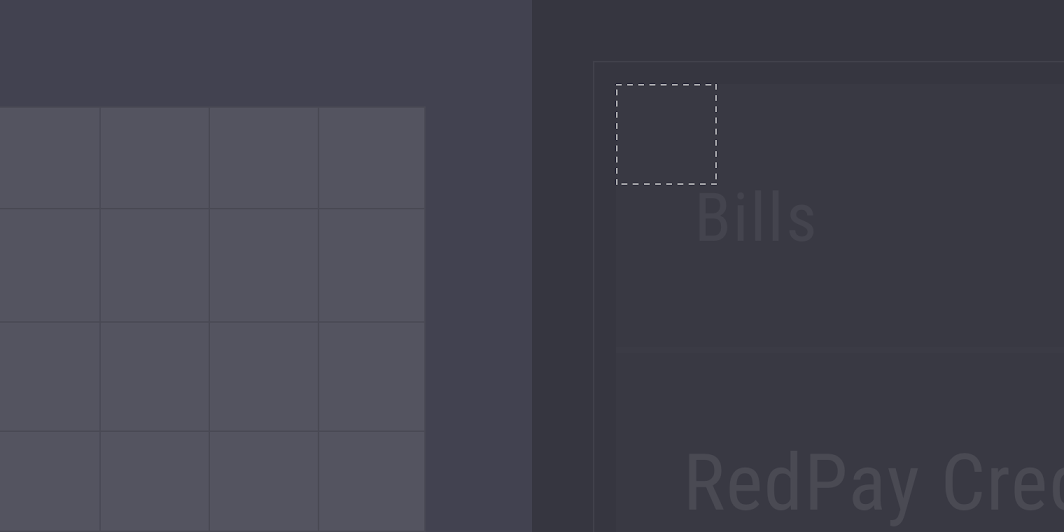
Rally Material theme: shape
ElementCategoryAttributeValue
ContainerLarge componentFamily
Size
Cut
0;0;0;0dp

Specs ​


Target area

The minimum touch target for interactive elements is 48 x 48 dp.
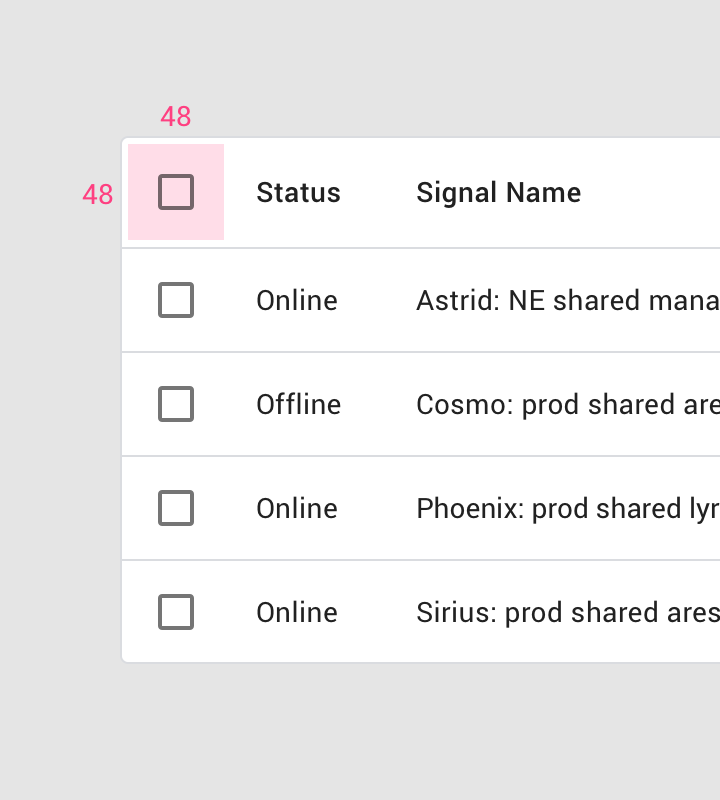
Touch target size for a checkbox or any other interactive element: 48 x 48dp

Element bounds

Targets can extend areas beyond the bounds of an element.
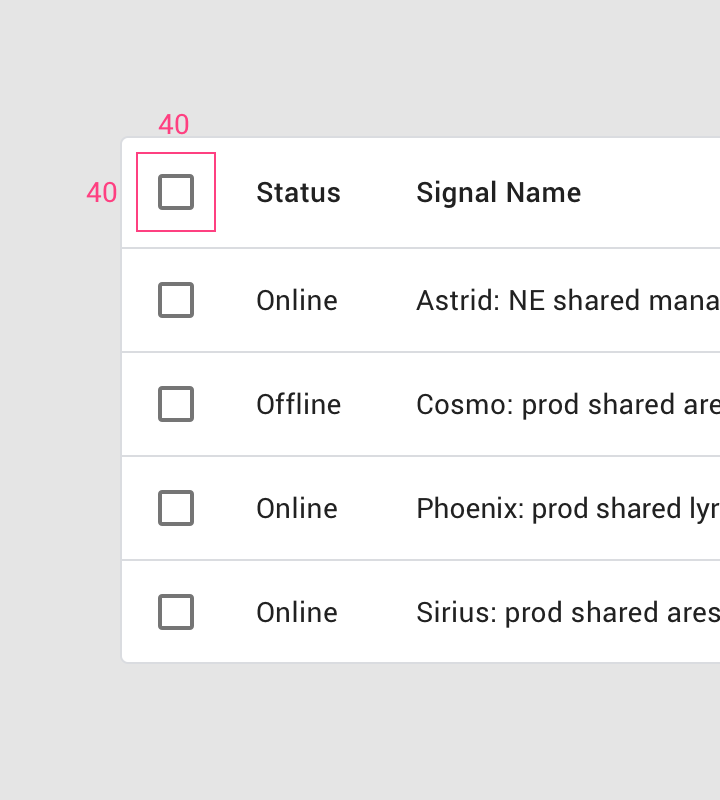
Icon size: 40 x 40dp

Table cell padding

Table cell padding is minimized to improve content density.
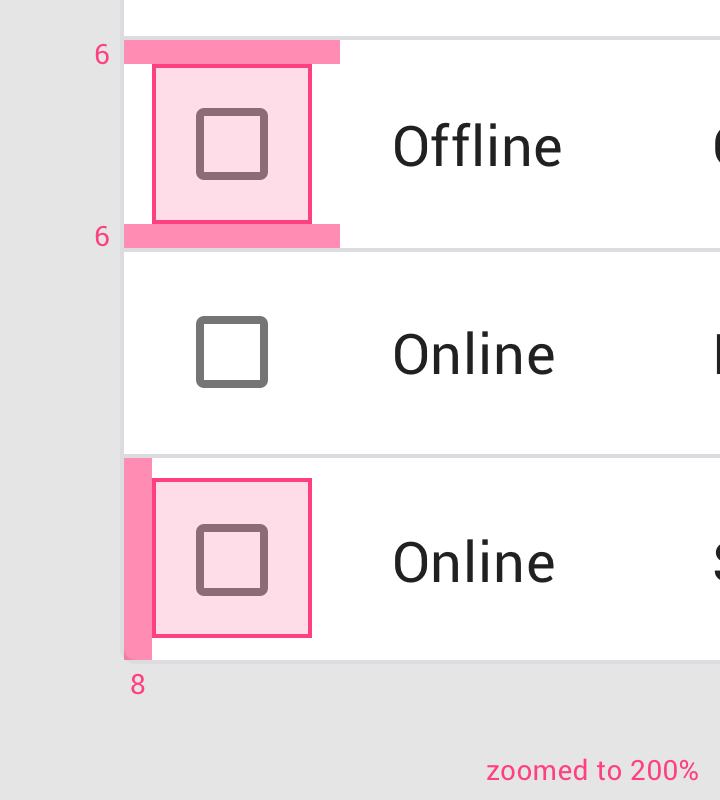
• Table cell top & bottom padding: 6dp, • Table cell left padding: 8dp
• Table cell top & bottom padding: 6dp
• Table cell left padding: 8dp

Corner radius

Data tables have a rectangular shape by default, with subtly rounded corners.
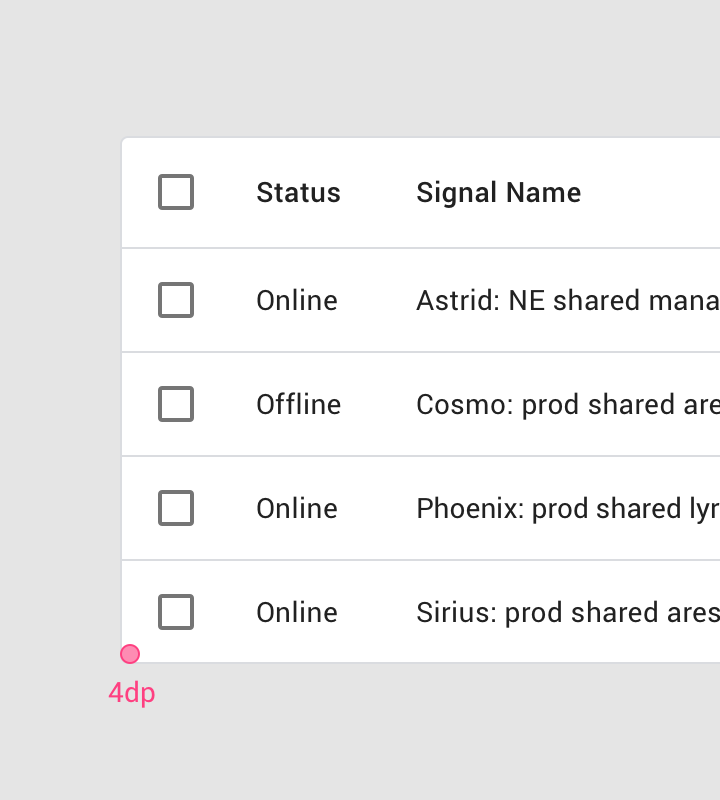
Table corner radius: 4dp

Elevation

Data tables don’t express elevation as they're often in front of solid color backgrounds. They also don’t move in front of or behind other surfaces.
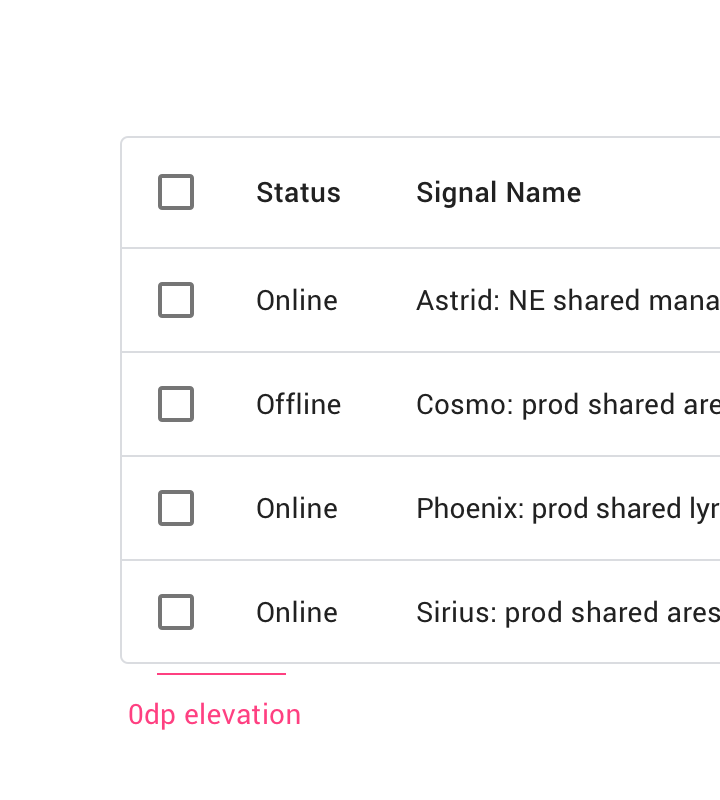
Specs: elevation: 0dp
Elevation: 0dp

Container outline

An outline can separate a table from either another table or other components.
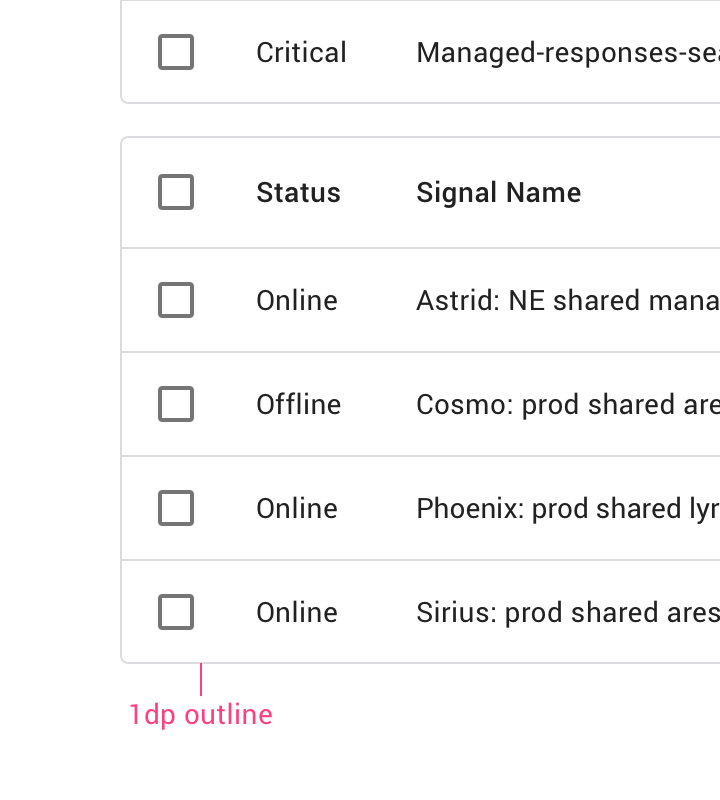
Specs: container outline: 1dp
Container outline: 1dp

Height and padding ​


• Header row height: 56dp • Row height: 52dp (4dp shorter than the header row) • Padding: 16dp • Container dimensions
• Header row height: 56dp
• Row height: 52dp (4dp shorter than the header row)
• Padding: 16dp
• Container dimensions expand to fit content

Numeric alignment ​

Align numbers to the right for improved scannability.
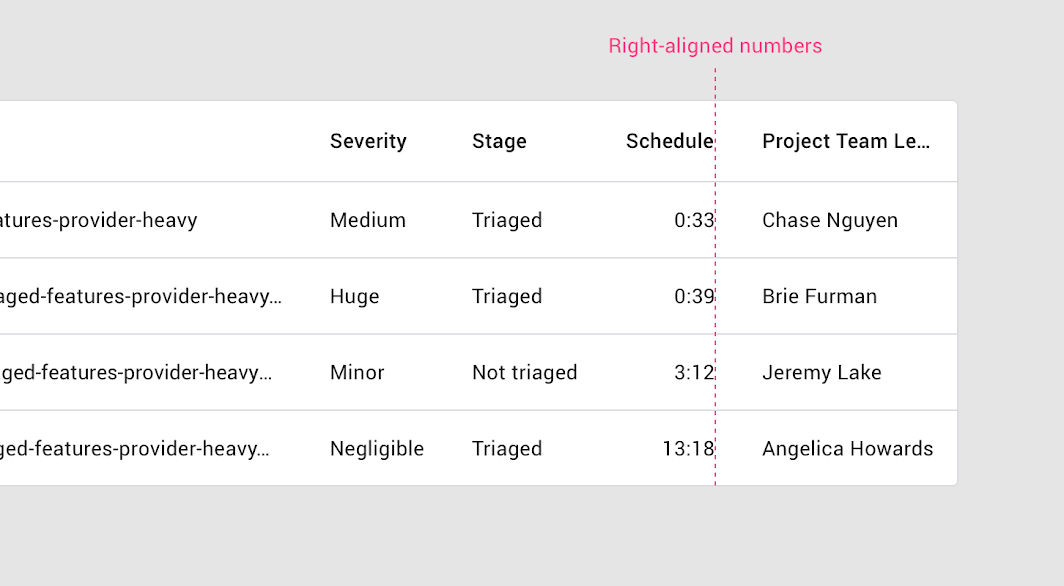
Numbers in the column are right-aligned with the column header name
Pager
Previous pageChips
Next pageDate pickers

Released under the Apache-2.0

Copyright © 2018-Present Google

https://m2.material.io/components/data-tables

Released under the Apache-2.0

Copyright © 2018-Present Google