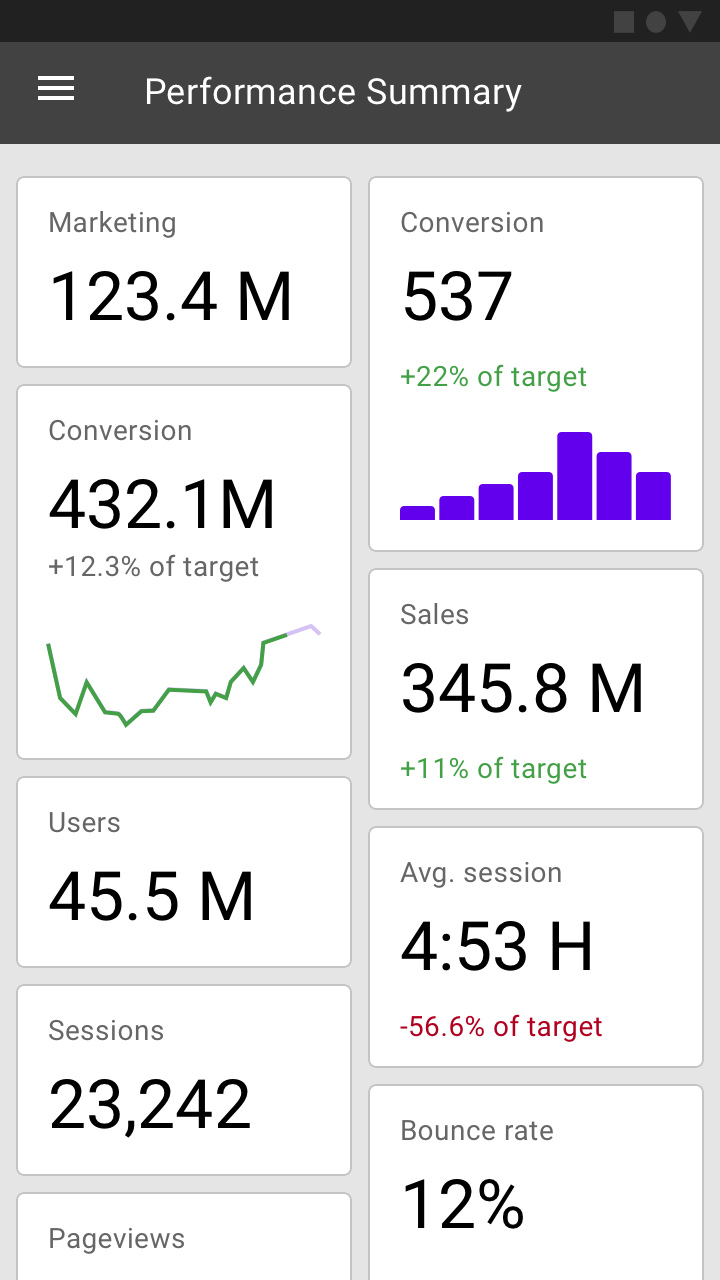
Data visualization
Data visualization depicts information in graphical form.
Principles
Data visualization is a form of communication that portrays dense and complex information in graphical form. The resulting visuals are designed to make it easy to compare data and use it to tell a story – both of which can help users in decision making.
Data visualization can express data of varying types and sizes: from a few data points to large multivariate datasets.
Accurate
Prioritize data accuracy, clarity, and integrity, presenting information in a way that doesn’t distort it.
Helpful
Help users navigate data with context and affordances that emphasize exploration and comparison.
Scalable
Adapt visualizations for different device sizes, while anticipating user needs on data depth, complexity, and modality.
Types
Data visualization can be expressed in different forms. Charts are a common way of expressing data, as they depict different data varieties and allow data comparison.
The type of chart you use depends primarily on two things: the data you want to communicate, and what you want to convey about that data. These guidelines provide descriptions of various different types of charts and their use cases.
Types of charts
Change over time
Change over time charts show data over a period of time, such as trends or comparisons across multiple categories.
Common use cases include:
- Stock price performance
- Health statistics
- Chronologies
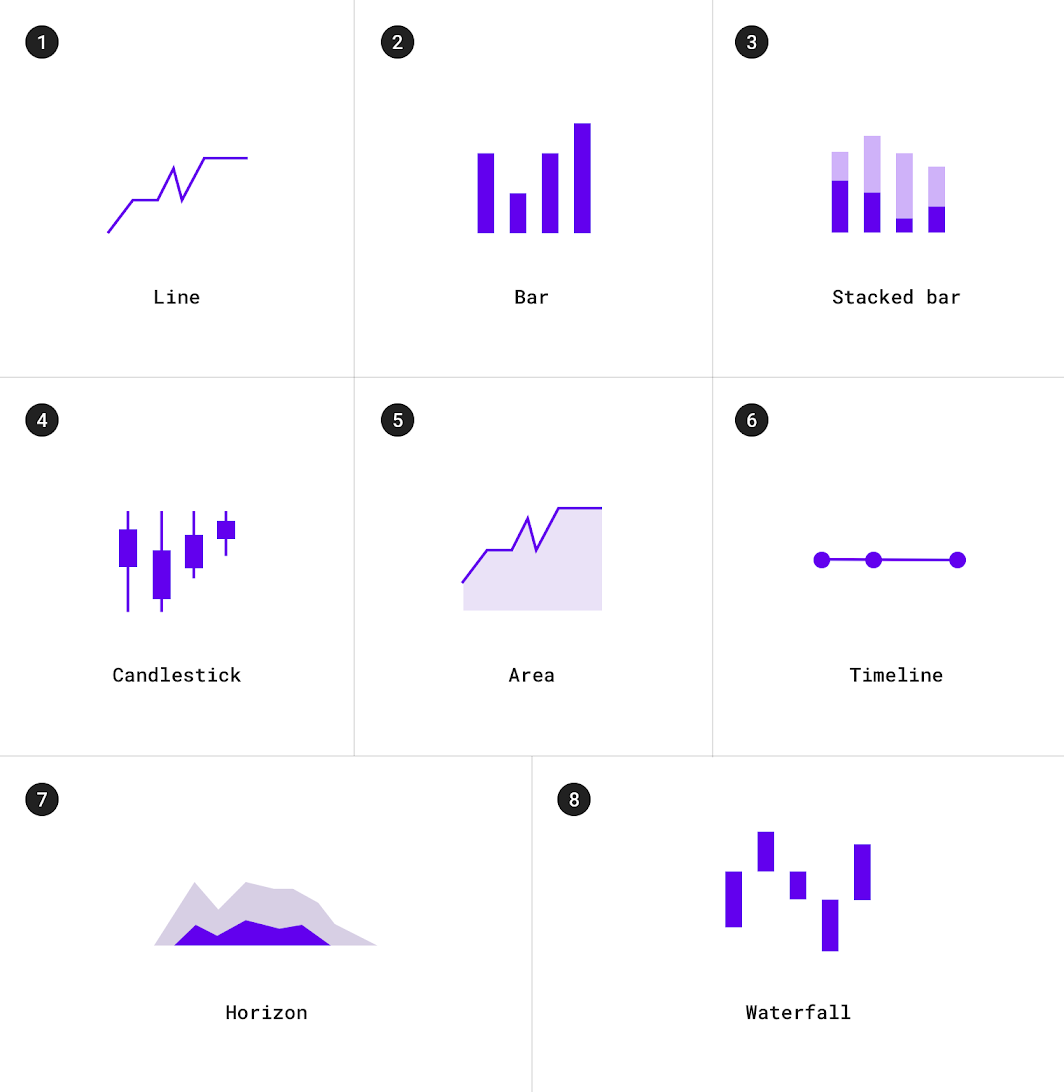
1. Line charts
2. Bar charts
3. Stacked bar charts
4. Candlestick charts
5. Area charts
6. Timelines
7. Horizon charts
8. Waterfall charts
Category comparison
Category comparison charts compare data between multiple distinct categories.
Use cases include:
- Income across different countries
- Popular venue times
- Team allocations
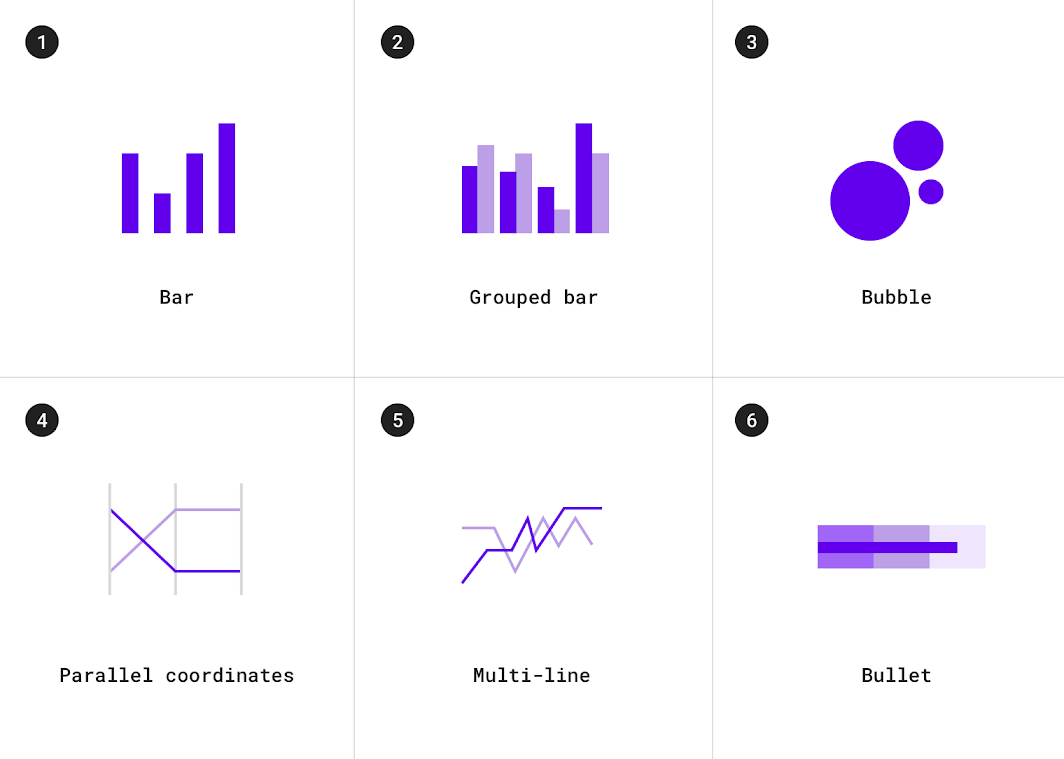
1. Bar charts
2. Grouped bar charts
3. Bubble charts
4. Multi-line charts
5. Parallel coordinate charts
6. Bullet charts
Ranking
Ranking charts show an item’s position in an ordered list.
Use cases include:
- Election results
- Performance statistics
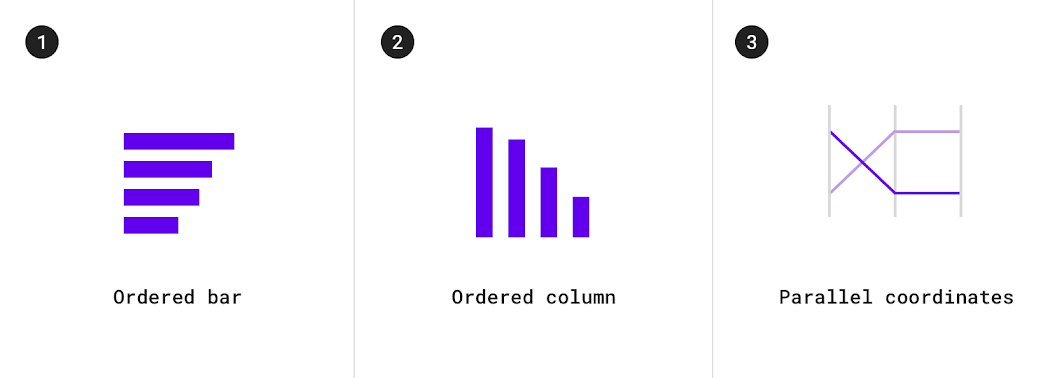
1. Ordered bar charts
2. Ordered column charts
3. Parallel coordinate charts
Part-to-whole
Part-to-whole charts show how partial elements add up to a total.
Use cases include:
- Consolidated revenue of product categories
- Budgets
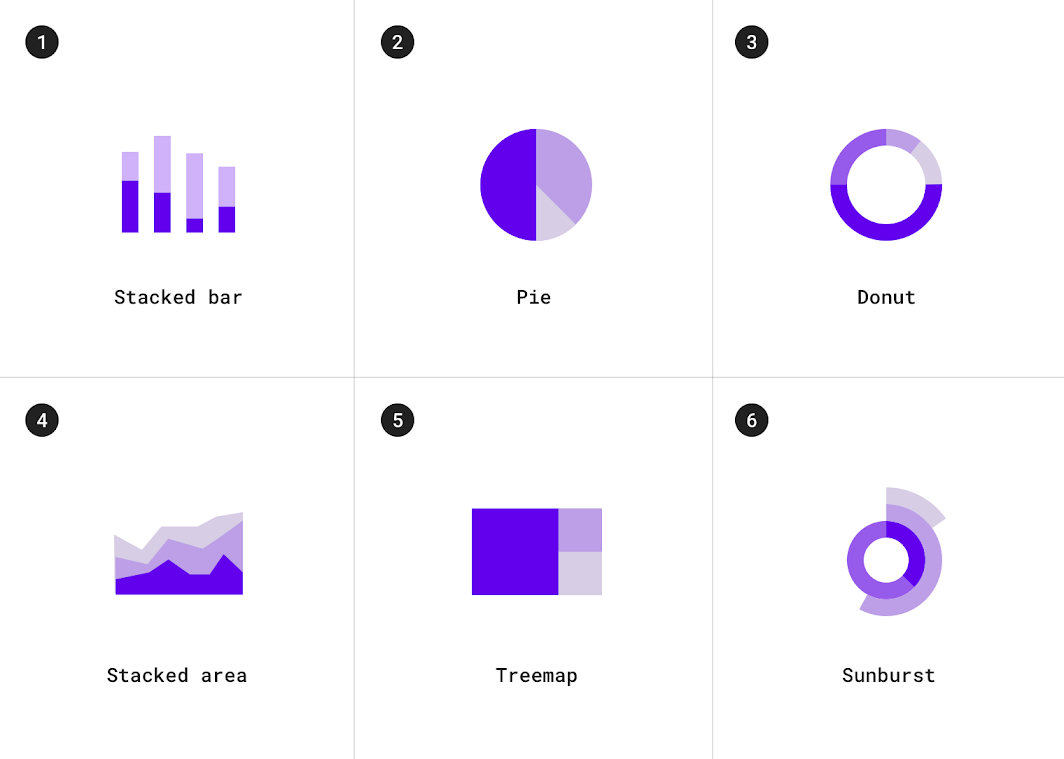
1. Stacked bar charts
2. Pie charts
3. Donut charts
4. Stacked area charts
5. Treemap charts
6. Sunburst charts
Correlation
Correlation charts show correlation between two or more variables.
Use cases include:
- Income and life expectancy
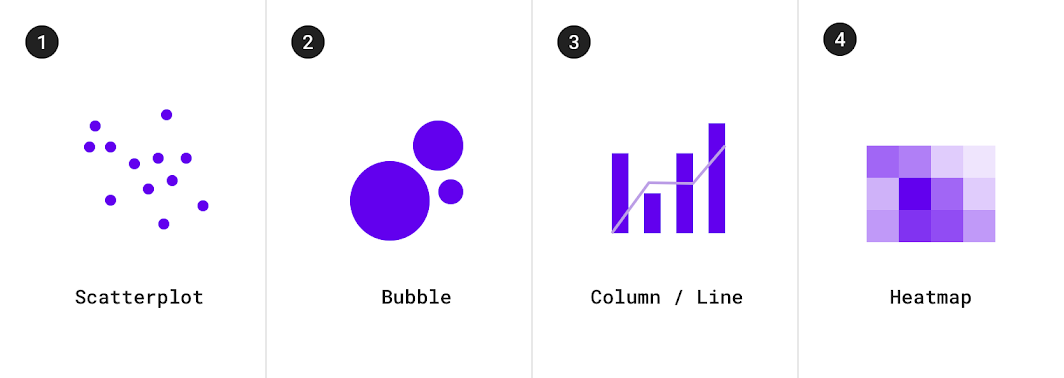
1. Scatterplot charts
2. Bubble charts
3. Column and line charts
4. Heatmap charts
Distribution
Distribution charts show how often each value occurs in a dataset.
Use cases include:
- Population distribution
- Income distribution
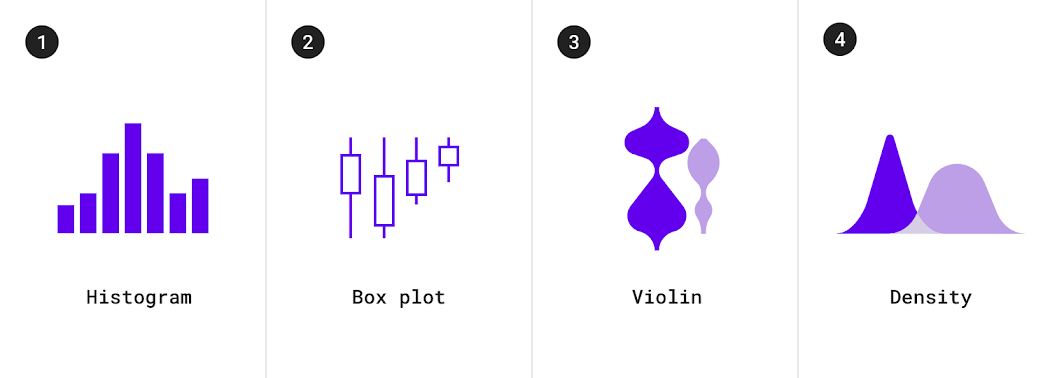
1. Histogram charts
2. Box plot charts
3. Violin charts
4. Density charts
Flow
Flow charts show movement of data between multiple states.
Use cases include:
- Fund transfers
- Vote counts and election results
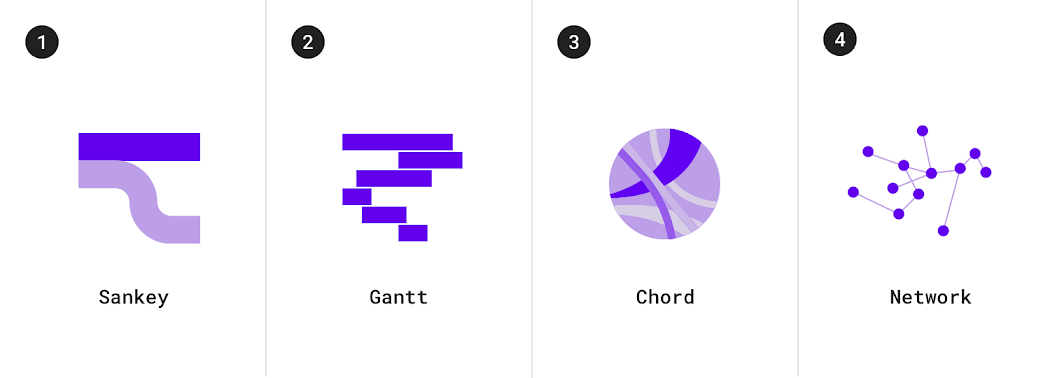
1. Sankey charts
2. Gantt charts
3. Chord charts
4. Network charts
Relationship
Relationship charts show how multiple items relate to one other.
Use cases include
- Social networks
- Word charts
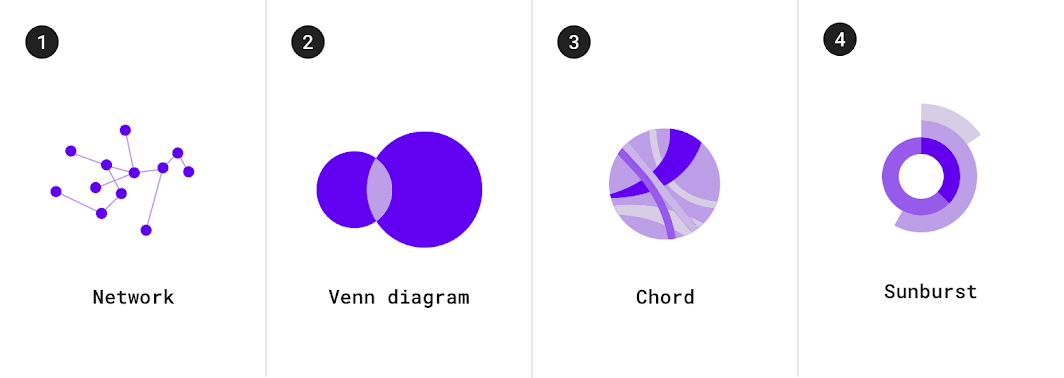
1. Network charts
2. Venn diagrams
3. Chord charts
4. Sunburst charts
Selecting charts
Multiple types of charts can be suitable for depicting data. The guidelines below provide insight into how to choose one chart over another.
Showing change over time
Change over time can be expressed using a time series chart, which is a chart that represents data points in chronological order. Charts that express change over time include: line charts, bar charts, and area charts.
| Type of chart | Usage | Baseline value * | Quantity of time series | Data type |
|---|---|---|---|---|
| Line chart | To express minor variations in data | Any value | Any time series (works well for charts with 8 or more time series) | Continuous |
| Bar chart | To express larger variations in data, how individual data points relate to a whole, comparisons, and ranking | Zero | 4 or fewer | Discrete or categorical |
| Area chart | To summarize relationships between datasets, how individual data points relate to a whole | Zero (when there’s more than one series) | 8 or fewer | Continuous |
* The baseline value is the starting value on the y-axis.
Bar and pie charts
Both bar charts and pie charts can be used to show proportion, which expresses a partial value in comparison to a total value.
- Bar charts express quantities through a bar’s length, using a common baseline
- Pie charts express portions of a whole, using arcs or angles within a circle
Bar charts, line charts, and stacked area charts are more effective at showing change over time than pie charts. Because all three of these charts share the same baseline of possible values, it’s easier to compare value differences based on bar length.
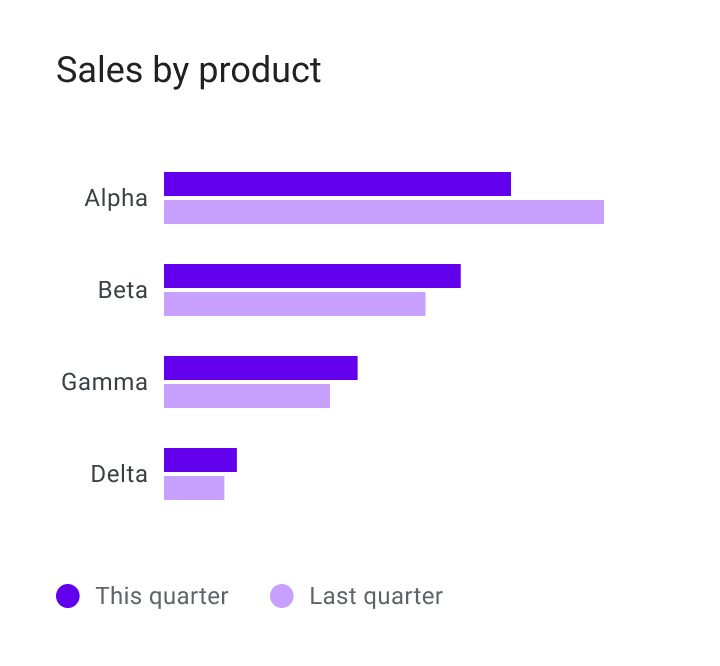
Do
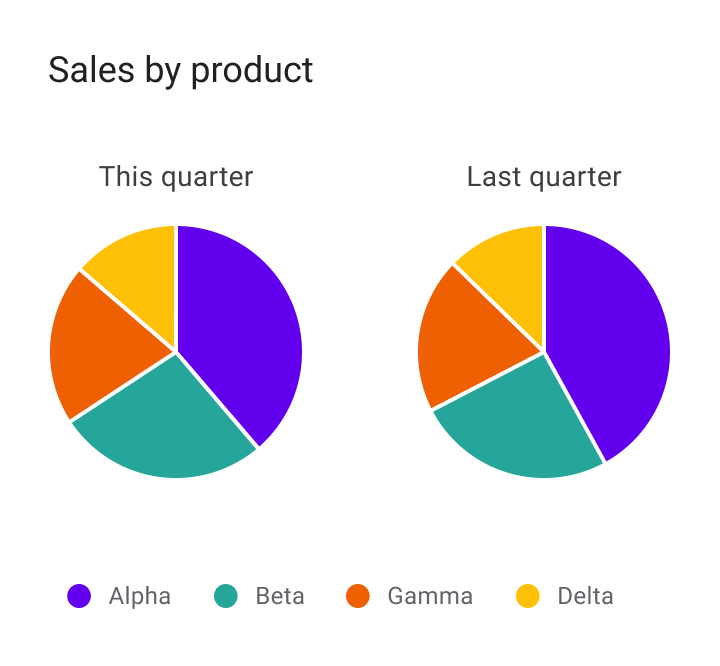
Don't
Area charts
Area charts come in several varieties, including stacked area charts and overlapped area charts:
- Stacked area charts show multiple time series (over the same time period) stacked on top of one another
- Overlapped area charts show multiple time series (over the same time period) overlapping one another
Overlapping area charts are not recommended with more than two time series, as doing so can obscure the data. Instead, use a stacked area chart to compare multiple values over a time interval (with time represented on the horizontal axis).
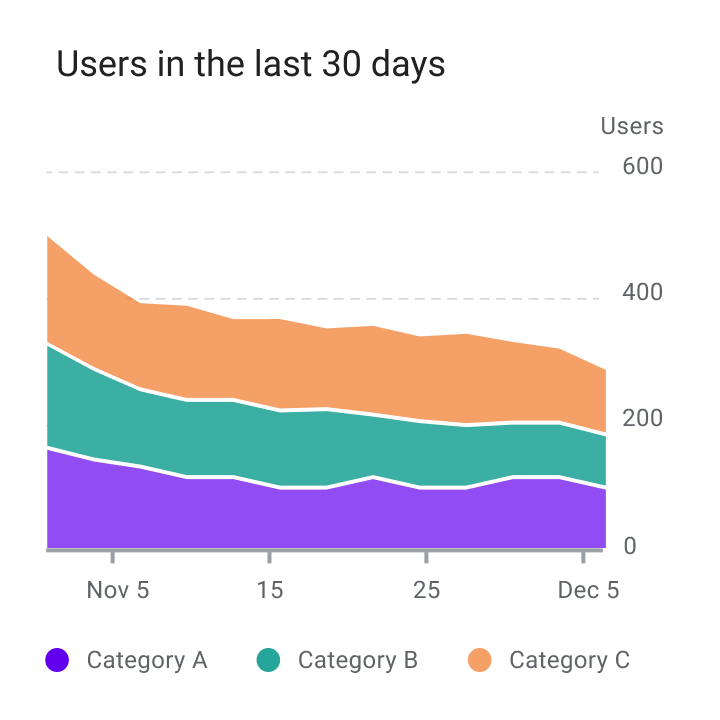
Do
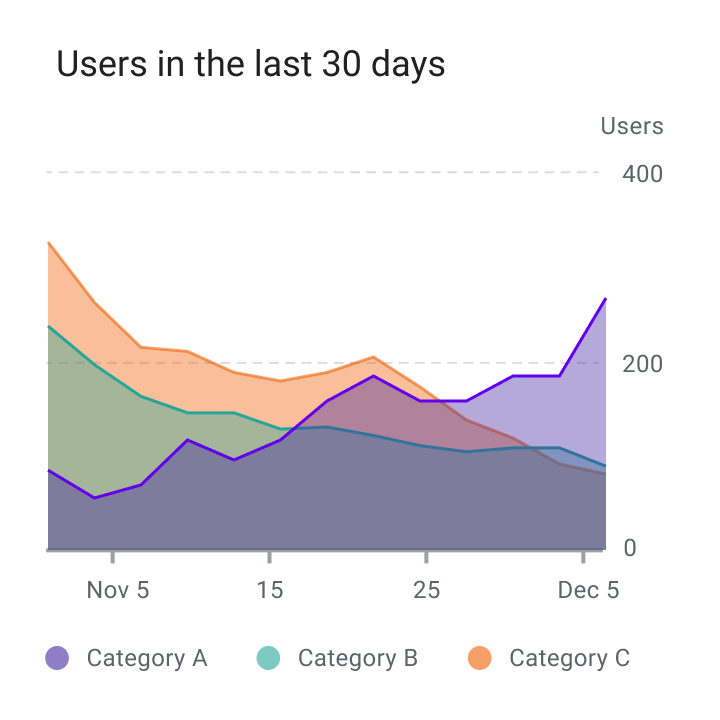
Don't
Style
Data visualizations use custom styles and shapes to make data easier to understand at a glance, in ways that suit the user’s needs and context.
Charts can benefit from customizing the following:
- Graphical elements
- Typography
- Iconography
- Axes and labels
- Legends and annotations
Styling different types of data
Visual encoding is the process of translating data into visual form. Unique graphical attributes can be applied to both quantitative data (such as temperature, price, or speed) and qualitative data (such as categories, flavors, or expressions).
These attributes include:
- Shape
- Color
- Size
- Area
- Volume
- Length
- Angle
- Position
- Direction
- Density
Expressing multiple attributes
Multiple visual treatments can be applied to more than one aspect of a data point. For example, a bar color can represent a category, while a bar’s length can express a value (like population size).
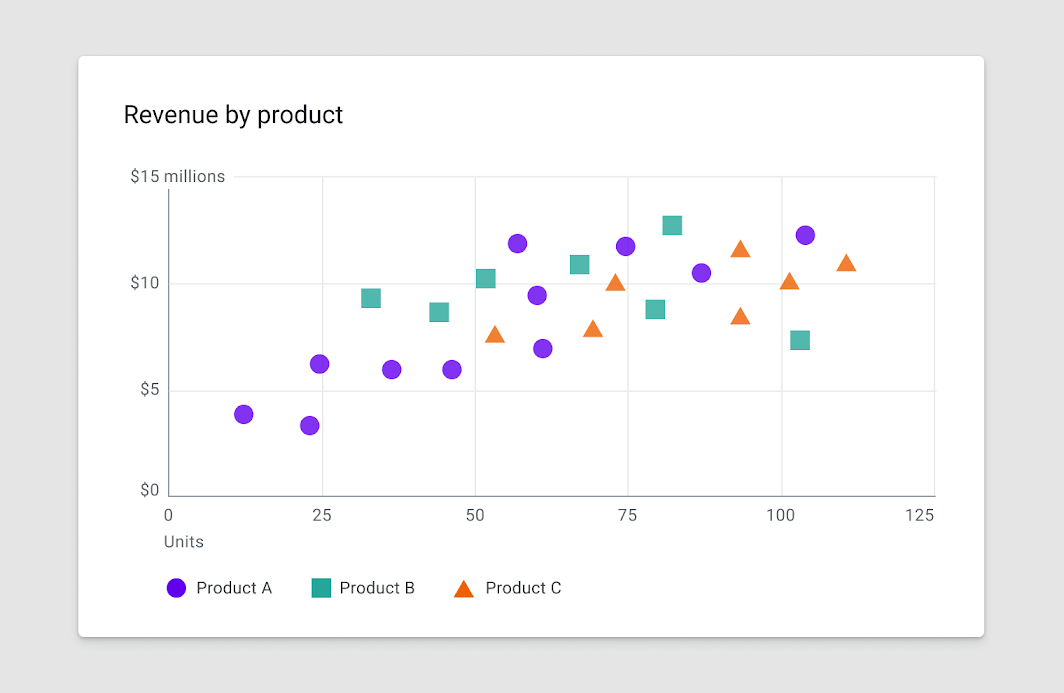
Shape
Charts can use shapes to display data in a range of ways. A shape can be styled as playful and curvilinear, or precise and high-fidelity, among other ways in between.
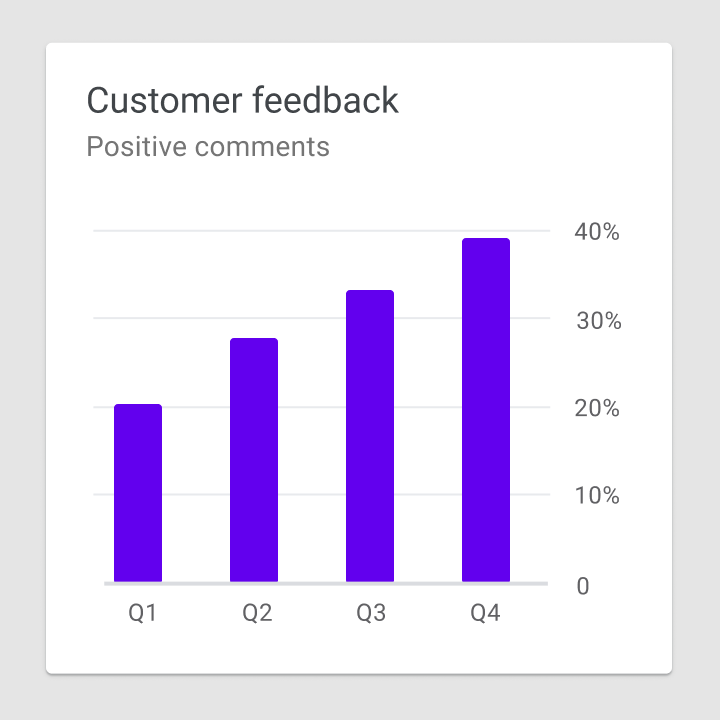
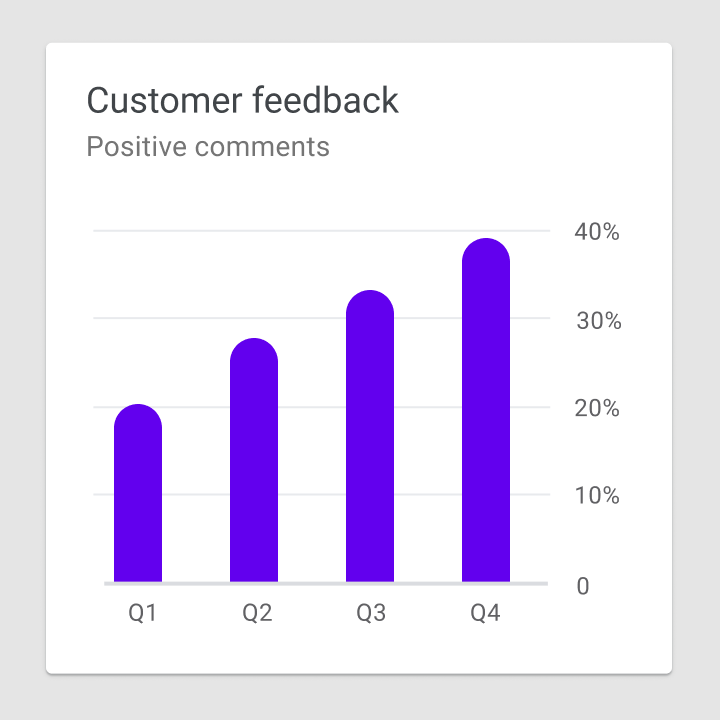
Level of shape detail
Charts can represent data at varying levels of precision. Data intended for close exploration should be represented by shapes that are suitable for interaction (in terms of touch target size and related affordances). Whereas data that’s intended to express a general idea or trend can use shapes with less detail.
Do
Don't
Color
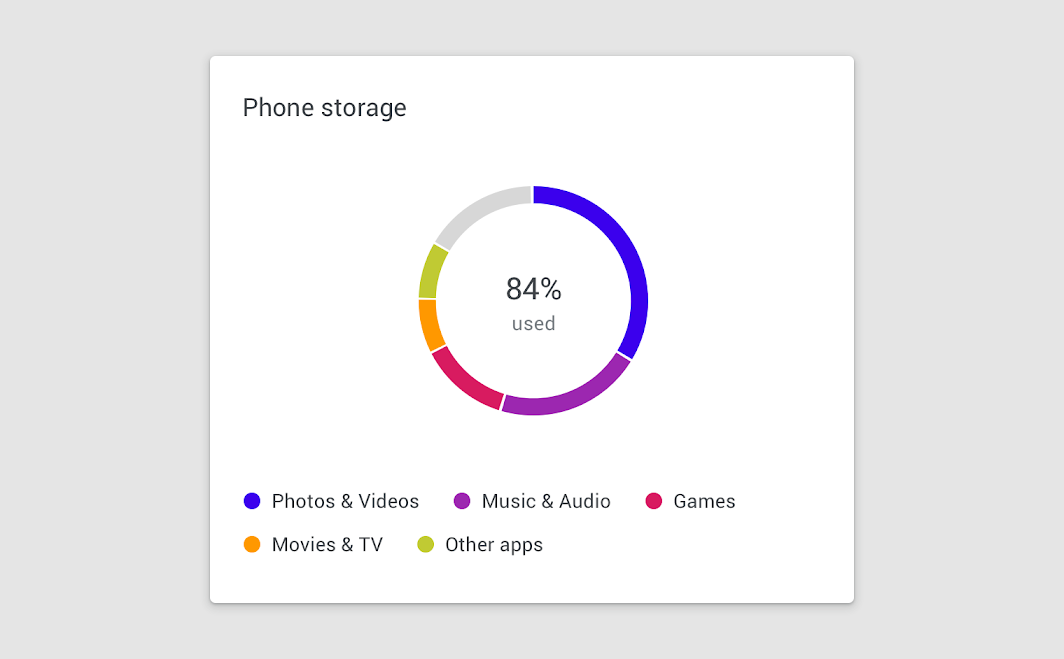
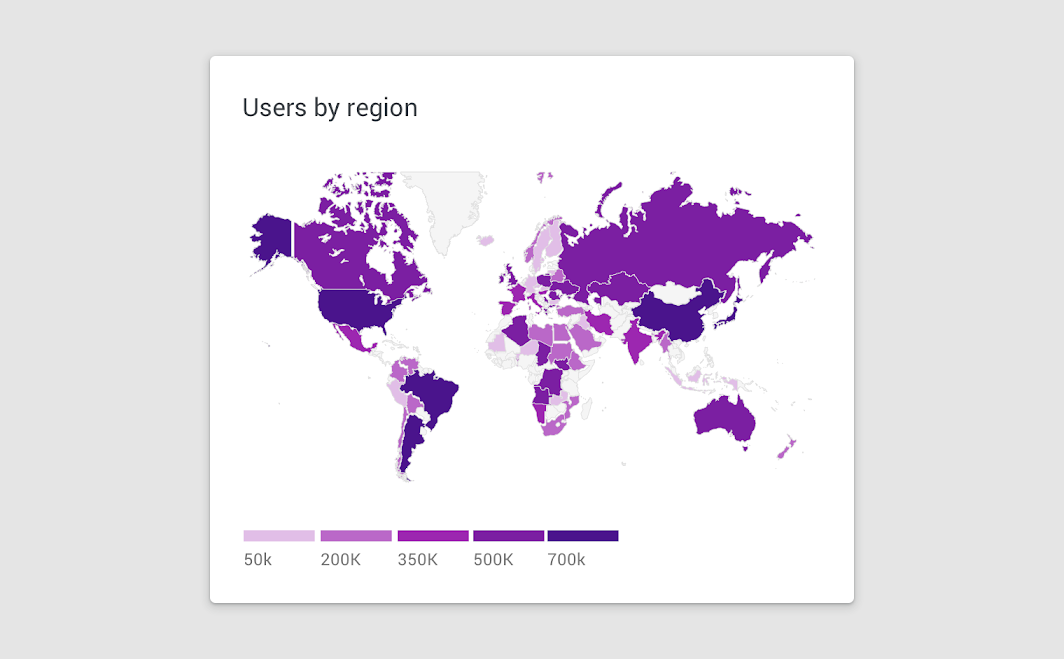
Color can be used to differentiate chart data in four primary ways:
- Distinguishing categories from one another
- Representing quantity
- Highlighting specific data
- Expressing meaning
Color distinguishes categories
Color represents quantity
Color highlights data
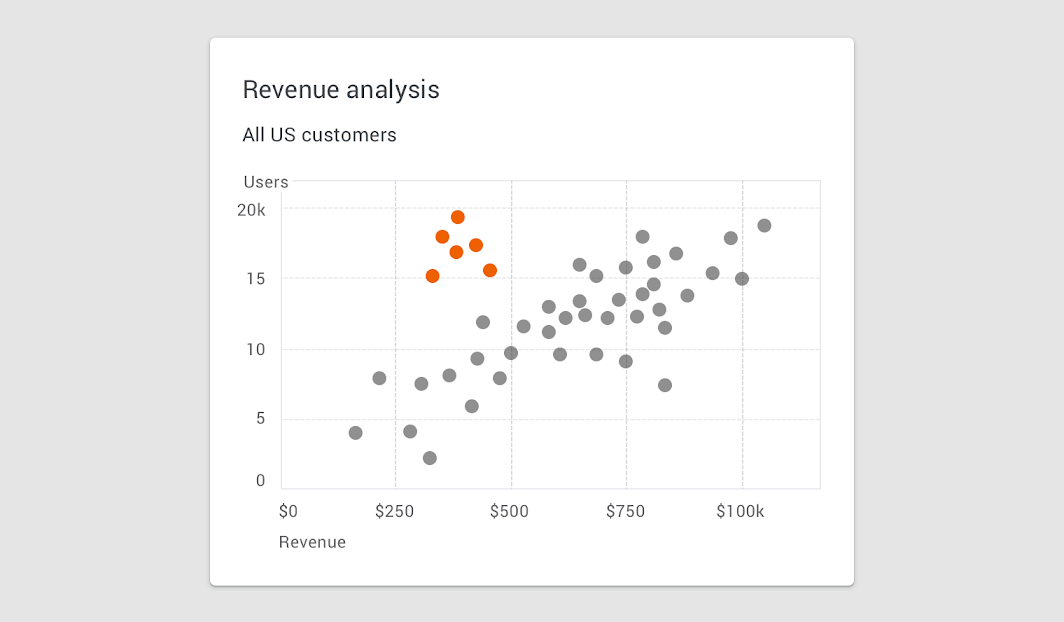
Areas of focus
Color can highlight an area of focus, when it is used sparingly. It’s not recommended to use a substantial amount of color highlights, as they can distract and hinder user focus.
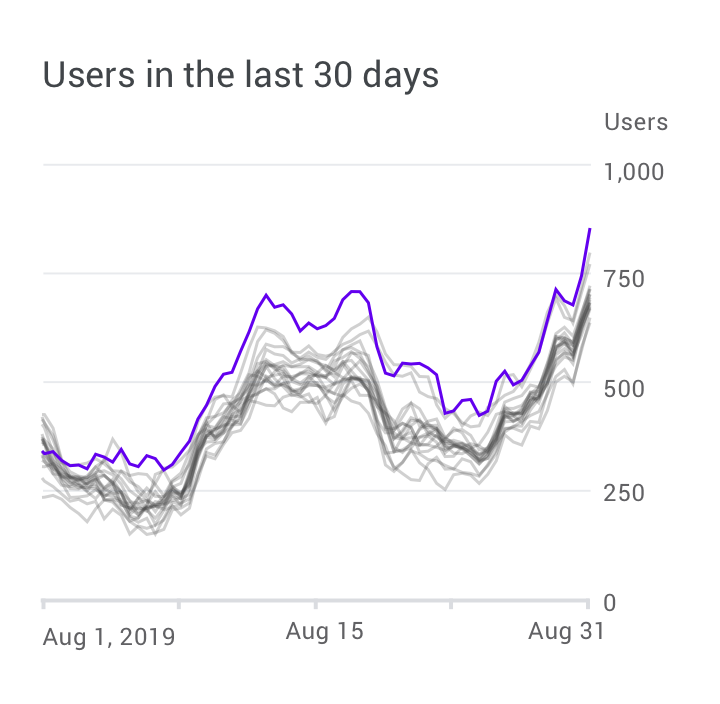
Do
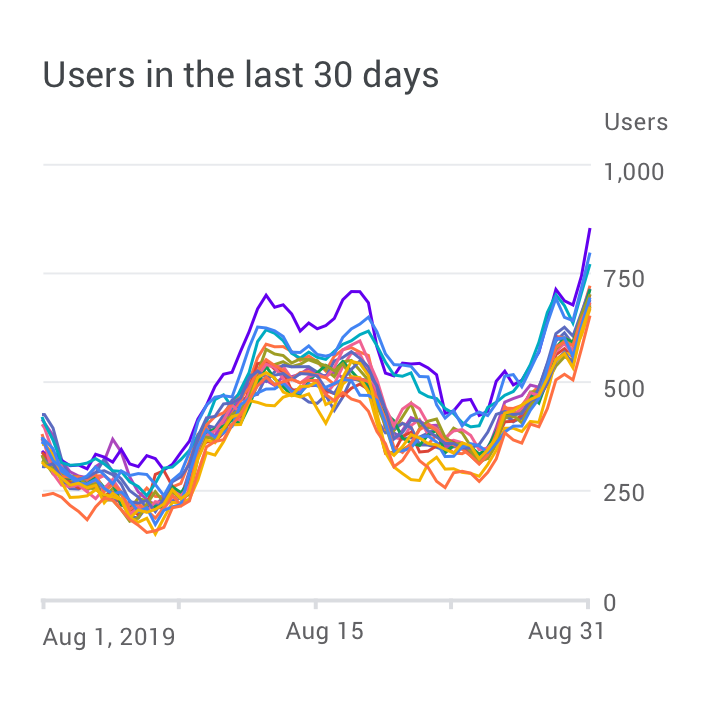
Caution
Color indicates meaning
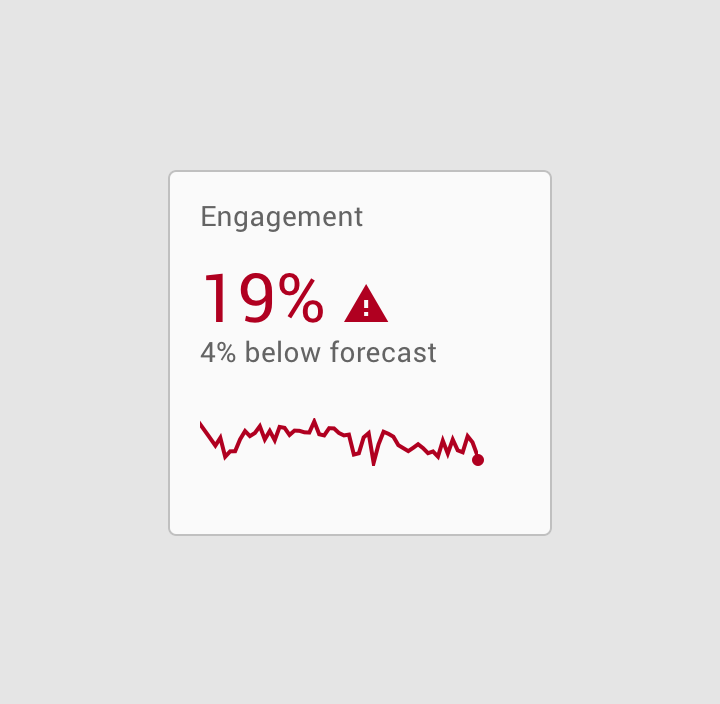
Do
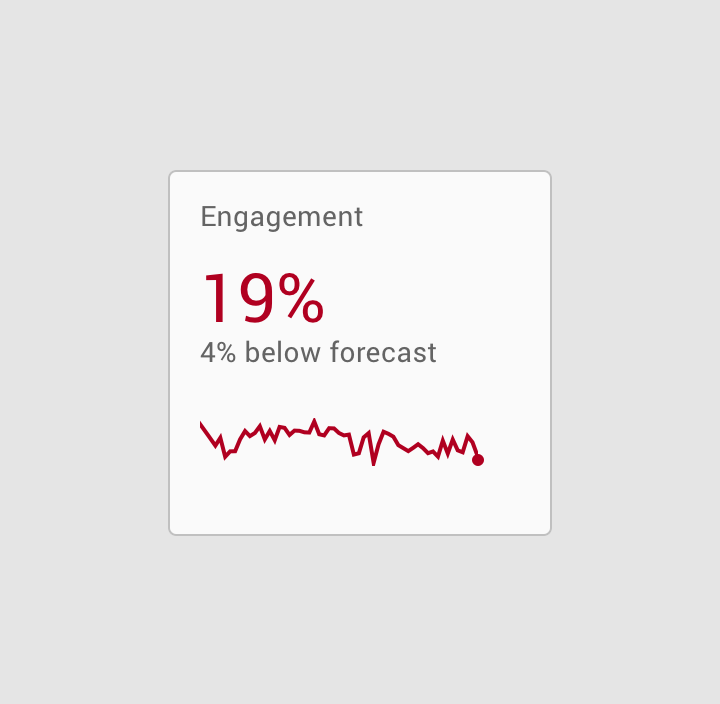
Don't
Accessibility
To accommodate users who don’t see color differences, you can use other methods to accentuate data, such as high-contrast shading, shape, or texture.
Applying text labels to data also helps clarify its meaning, while eliminating the need for a legend. See more in color contrast.
Line
Chart lines can express qualities about data, such as hierarchy, highlights, and comparisons. Line styles can be styled in different ways, such as using dashes or varied opacities.
Lines can be applied to specific elements, including:
- Annotations
- Forecasting elements
- Comparative tools
- Confidence intervals
- Anomalies
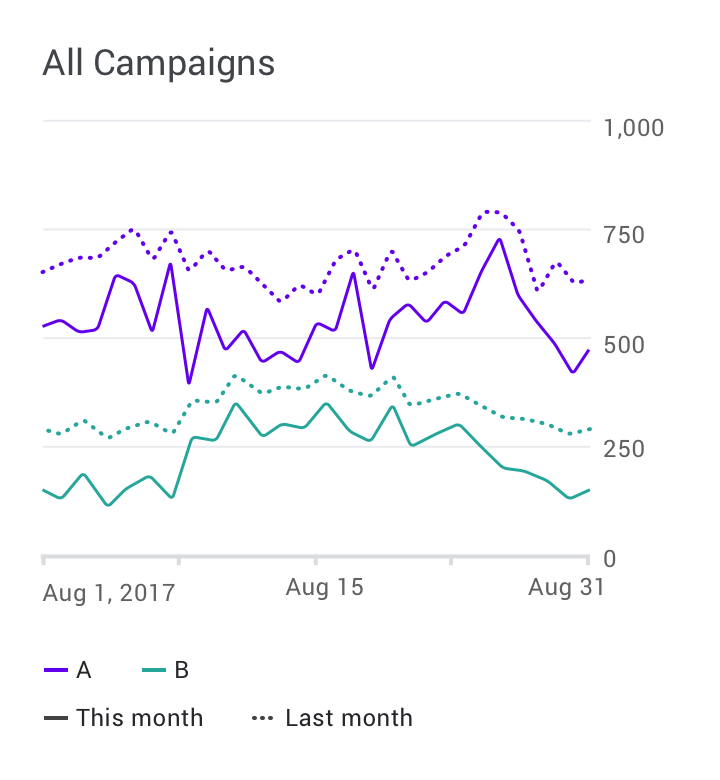
Do
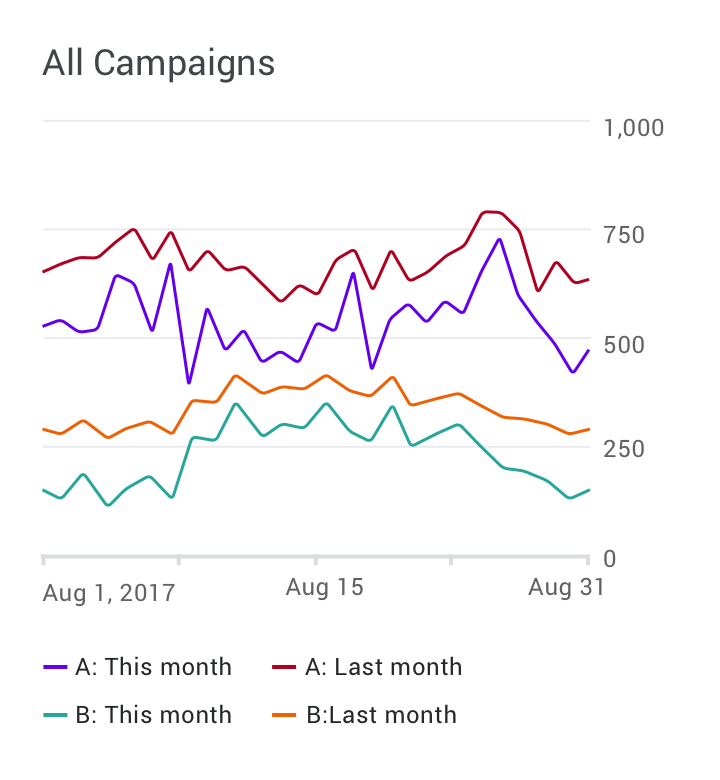
Don't
Typography
Text can be used to label different chart elements, including:
- Chart titles
- Data labels
- Axis labels
- Legend
The text with the highest level of hierarchy is usually the chart title, with axis labels and the legend having the lowest level of hierarchy.
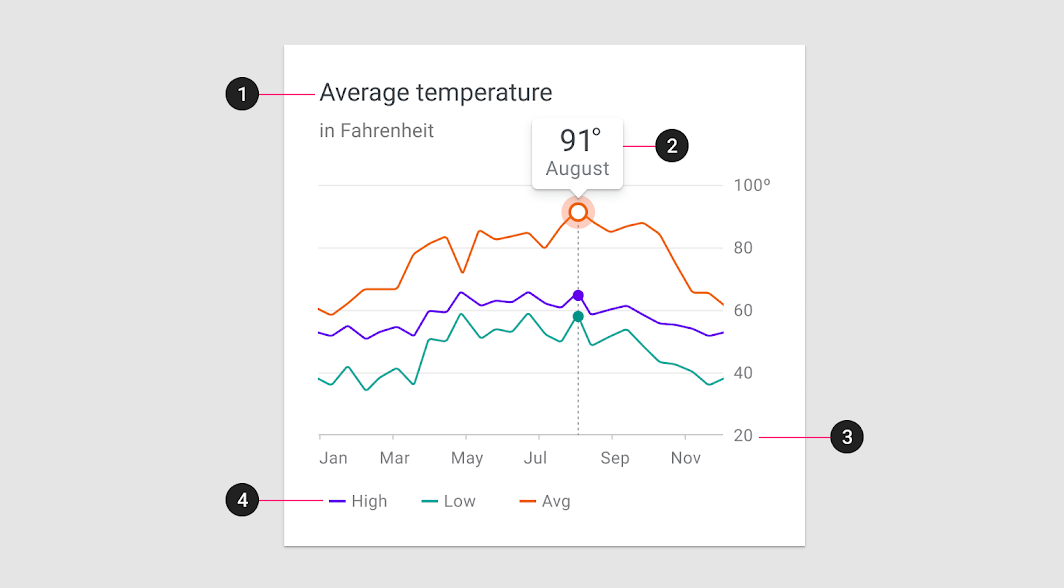
| Scale category | Typeface | Font | Size |
|---|---|---|---|
| 1. Chart title | Roboto | Regular | 18pt |
| Chart subtitle | Roboto | Regular | 14pt |
| 2. Data label | Roboto | Regular | 22pt |
| Sub-label | Roboto | Regular | 14pt |
| 3. Axis labels | Roboto | Regular | 12pt |
| 4. Legend labels | Roboto | Regular | 12pt |
Text weight
Headings and varying font weights can communicate which content is more (or less) important than other content in the hierarchy. However, these treatments should be used sparingly, with a limited number of typographic styles.
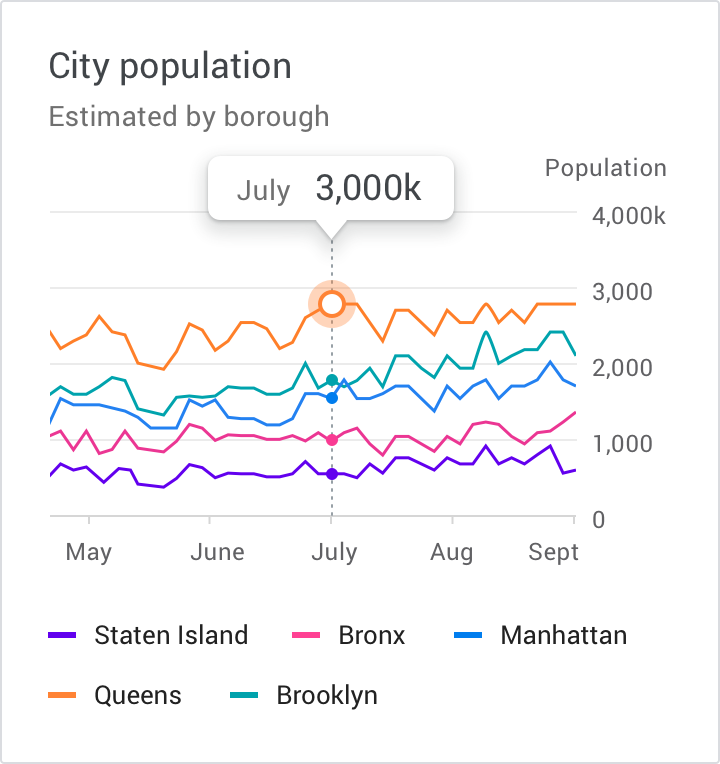
Do
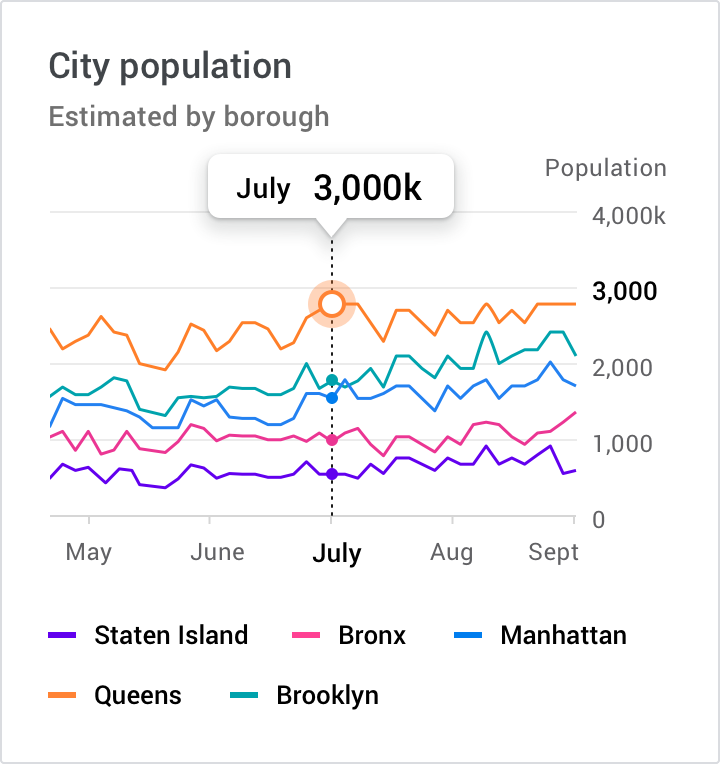
Don't
Iconography
Iconography can represent different types of data in a chart and improve a chart’s overall usability.
Iconography can be used for:
- Categorical data to differentiate groups or categories
- UI controls and actions, such as filter, zoom, save, and download
- States, such as errors, no data, completed states, and danger
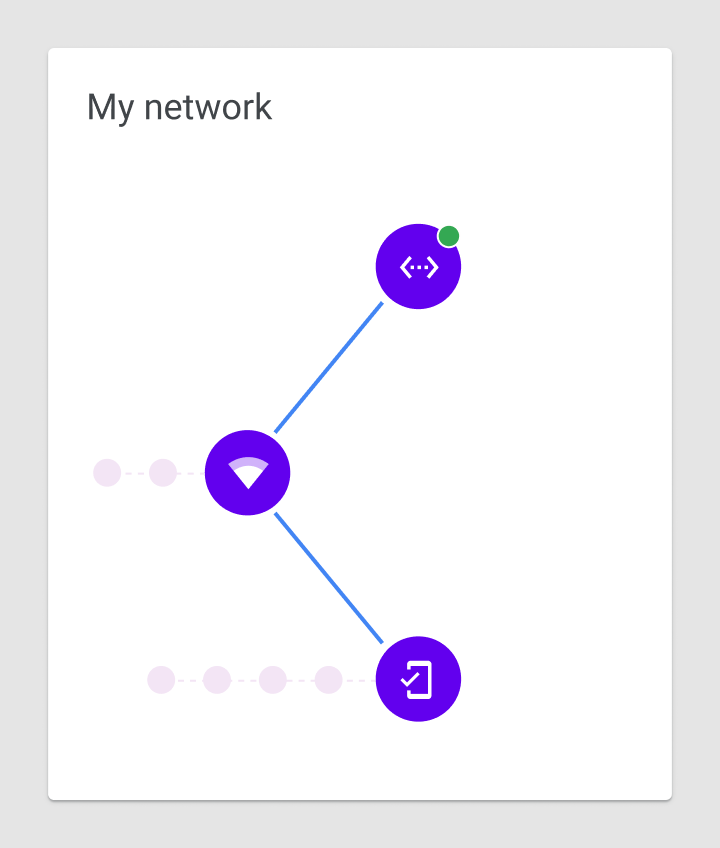
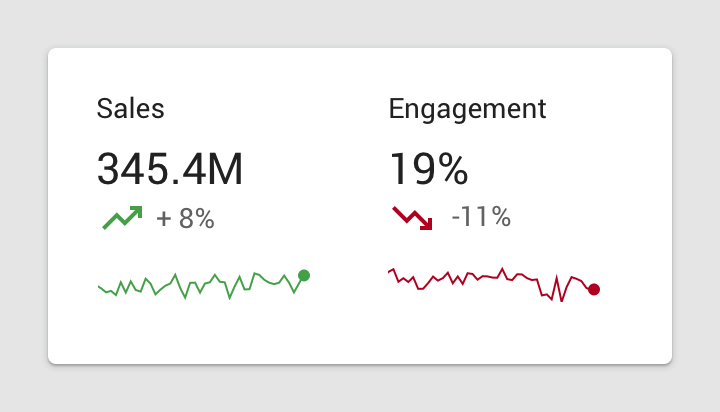
When placing icons in a chart, it’s recommended to use universally recognizable symbols, particularly when representing actions or states, such as: save, download, completed, error, and danger.
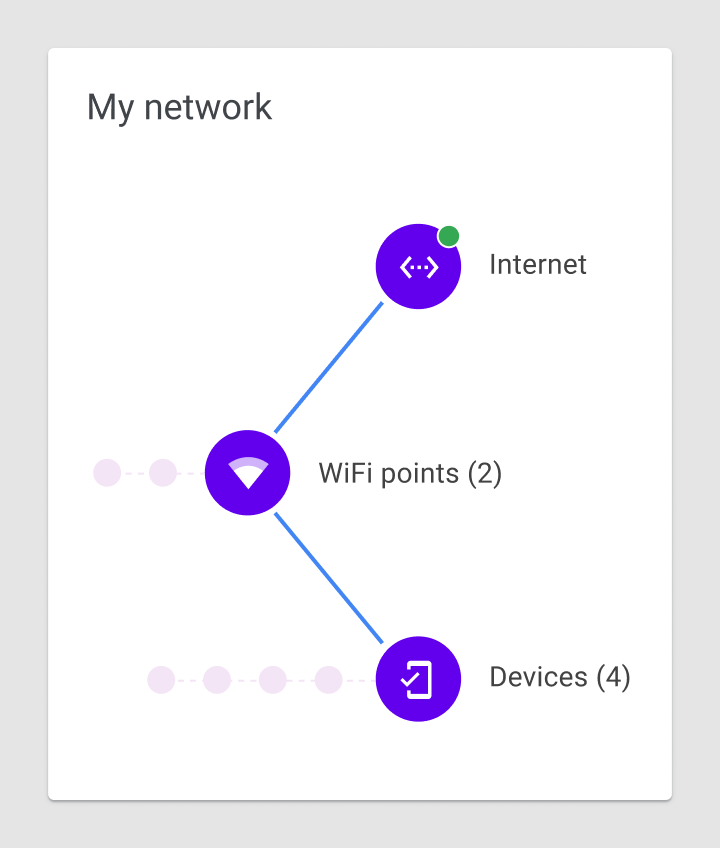
Do
Don't
Labelled axis
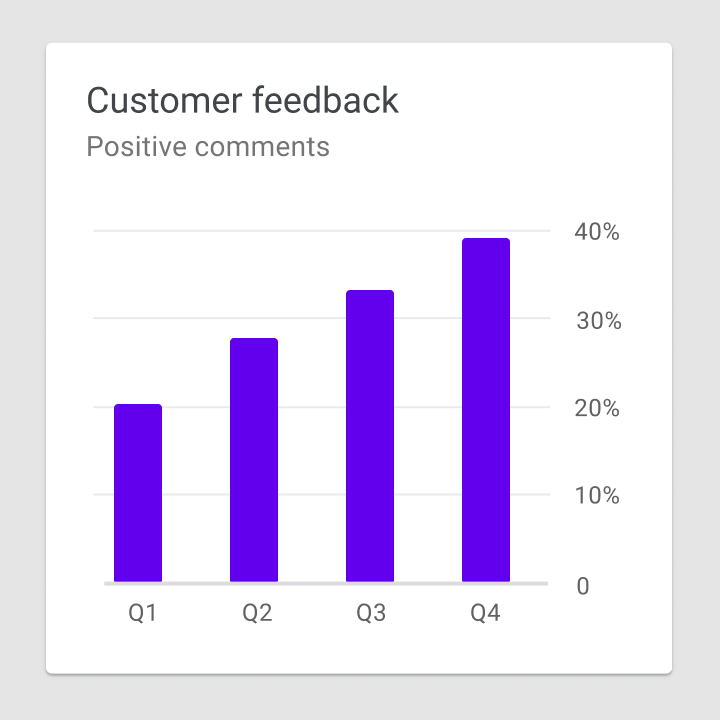
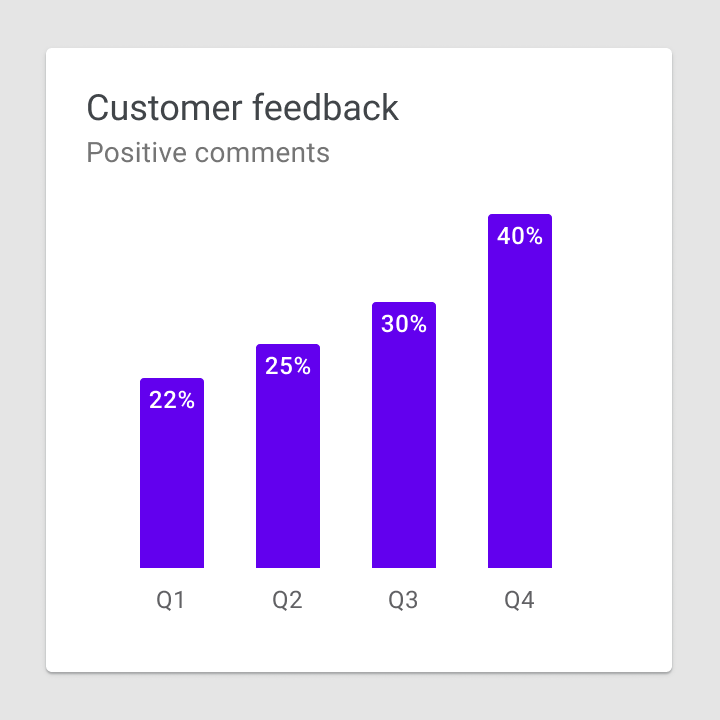
A labelled axis, or multiple axes, indicates the scale and scope of the data displayed. For example, line charts display a range of values along both horizontal and vertical labelled axes.
Bar chart baseline
Bar charts should start at a baseline (the starting value on the y-axis) of zero. Starting at a baseline that isn’t zero can cause the data to be perceived incorrectly.
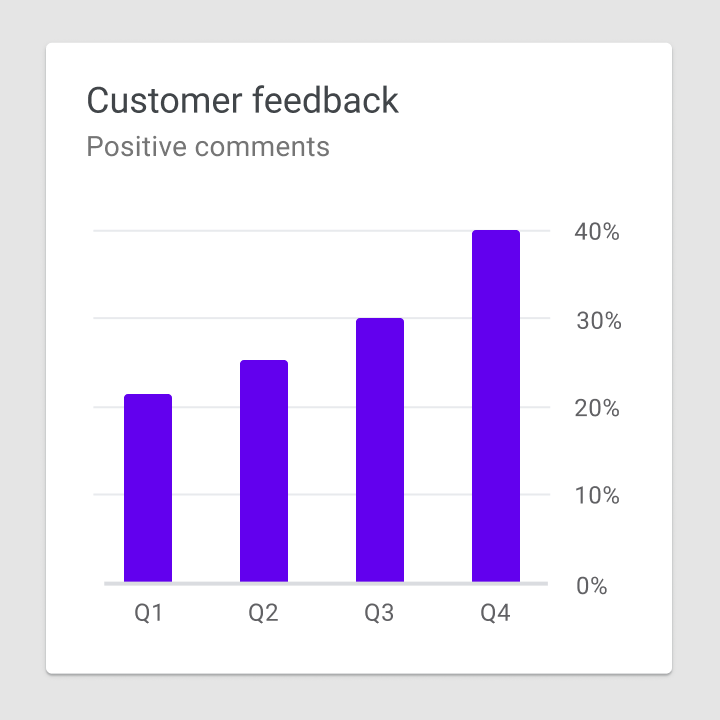
Do
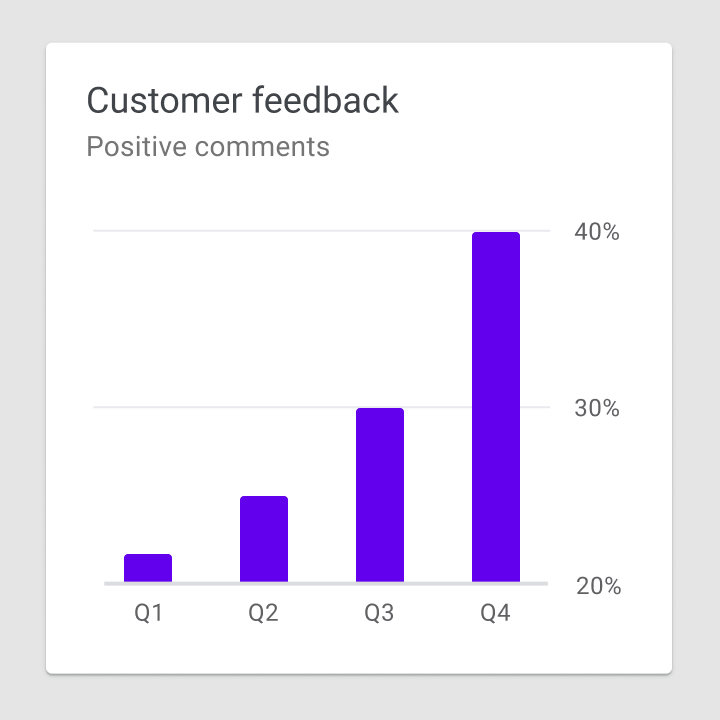
Don't
Axis labels
Label usage should reflect the most important data insights in a chart. Axis labels should be used as needed, and in consistent ways across a UI. Their presence should not inhibit reading the chart.
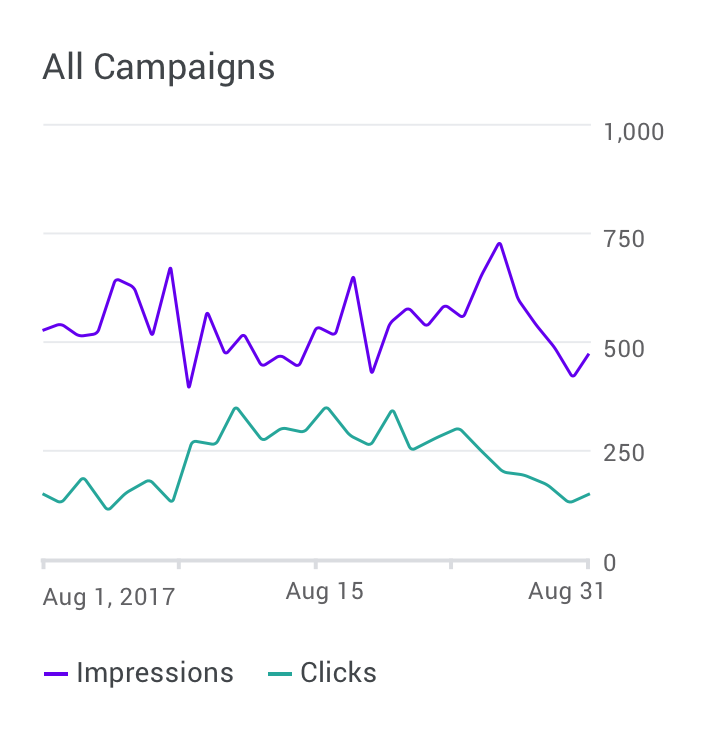
Do
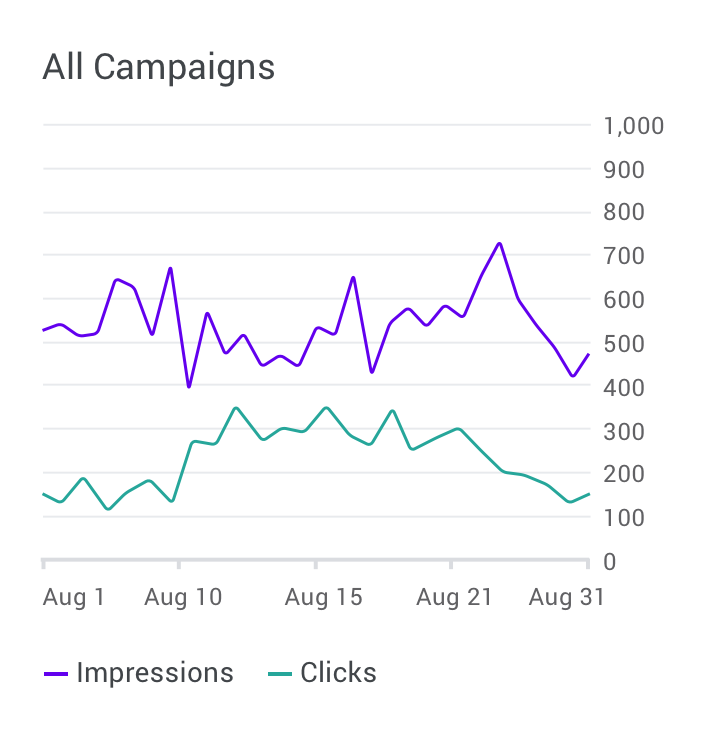
Don't
Text orientation
Text labels should be placed horizontally on the chart so that they are easy to read.
Text labels should not:
- Be rotated
- Stacked vertically
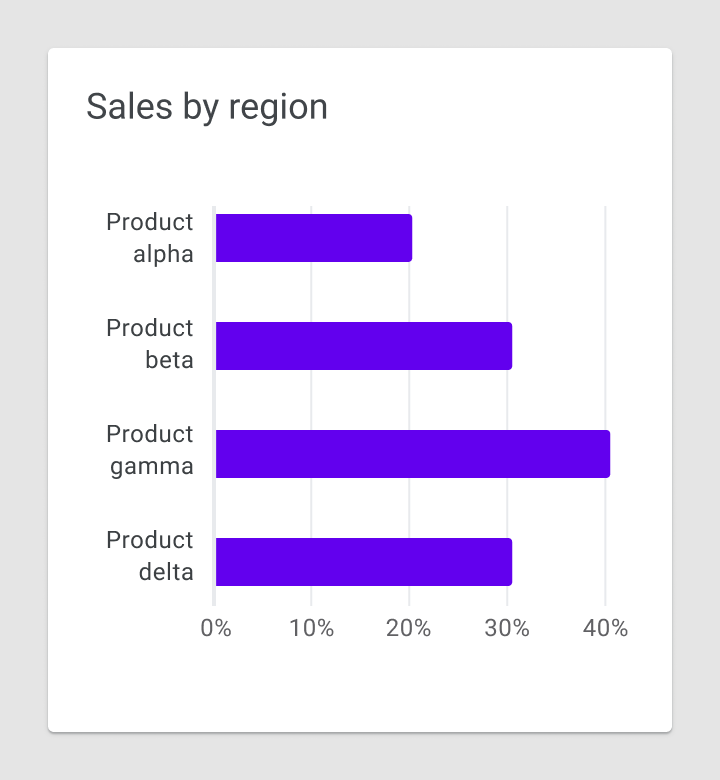
Do
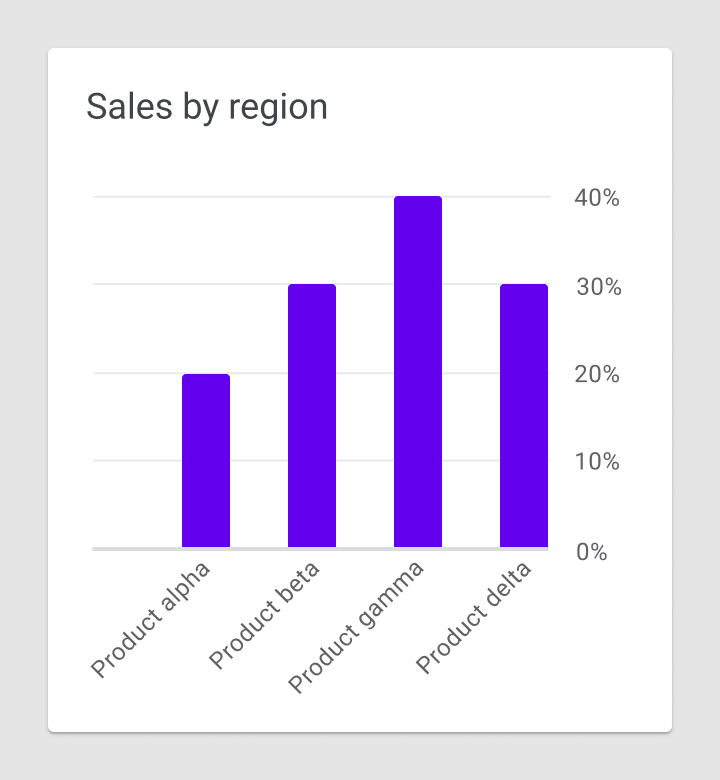
Caution
Legends and annotation
Legends and annotations describe a chart’s information. Annotations should highlight data points, data outliers, and any noteworthy content.
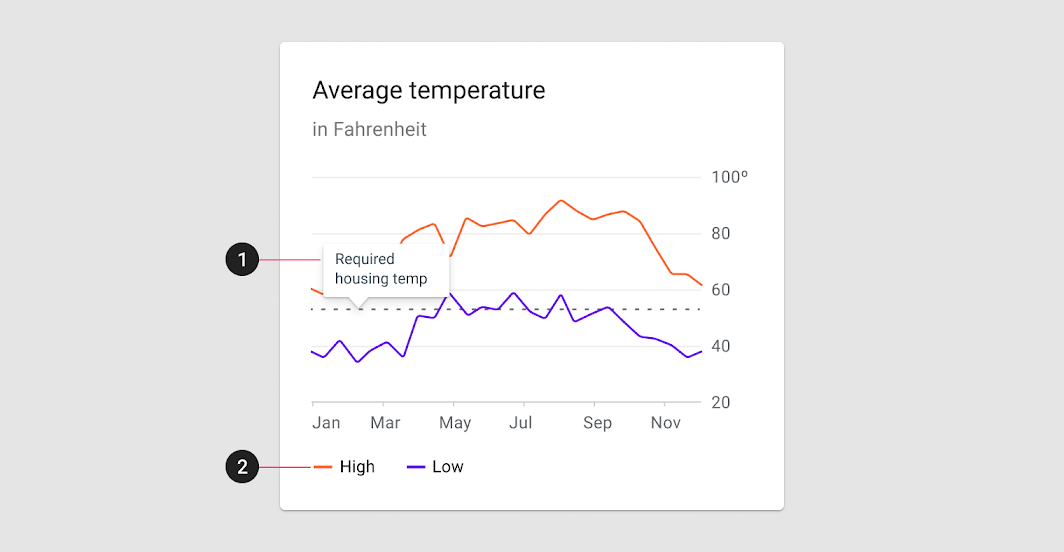
2. Legend
On desktop, it’s recommended to place a legend below a chart. On mobile, place the legend above the chart to keep it visible during interactions.
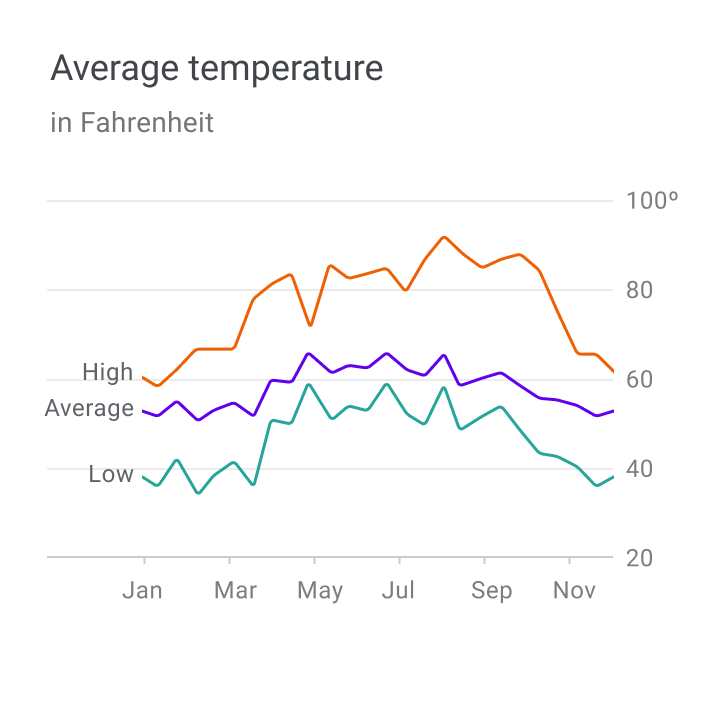
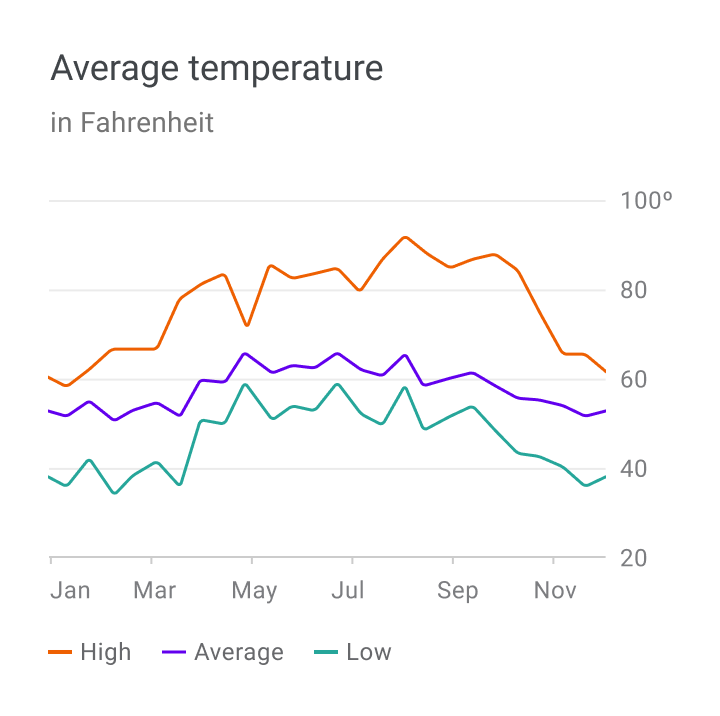
Labels and legends
Chart elements can be labeled directly in simple charts. However, charts that are dense (or part of a larger group of charts) can display labels in a legend.
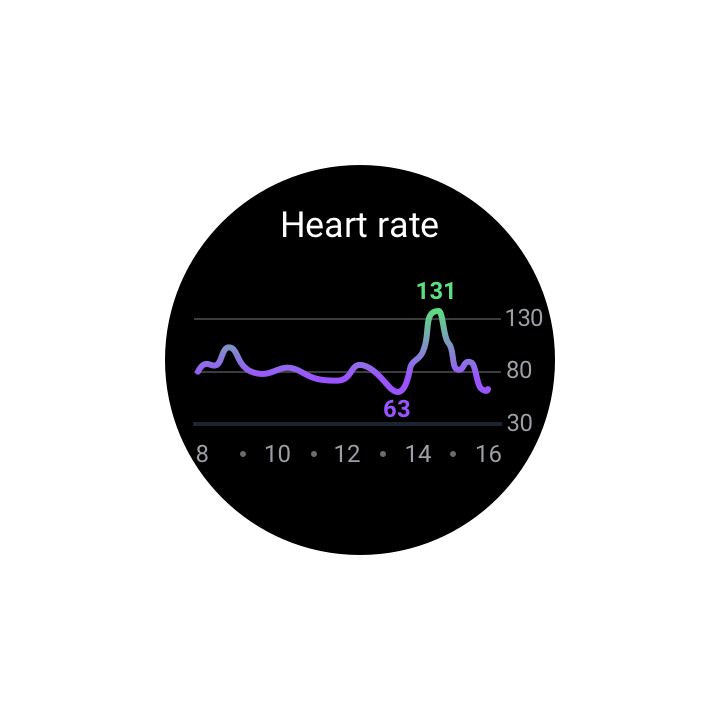
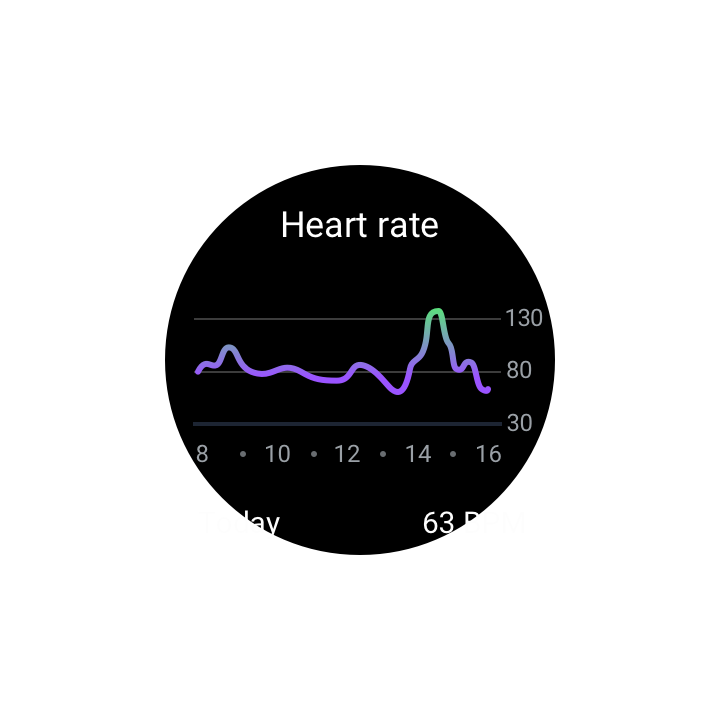
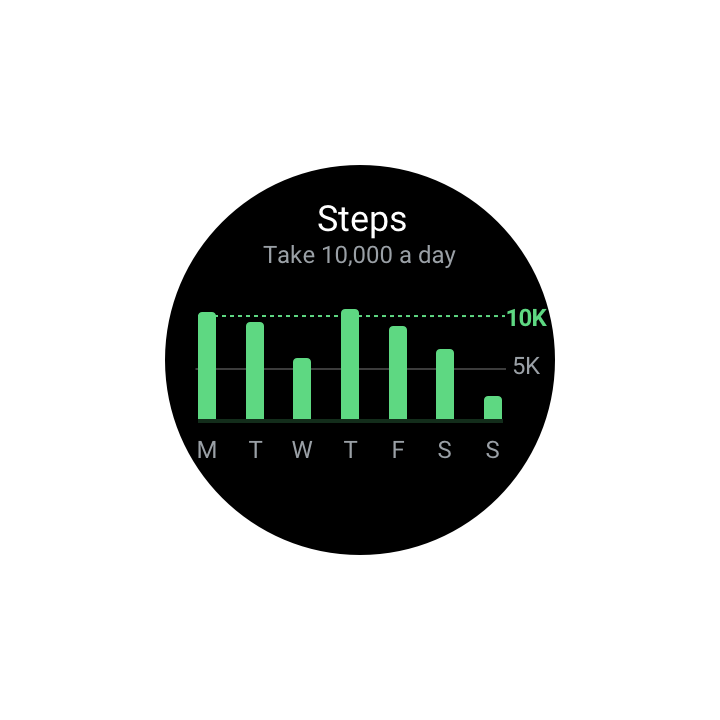
Small displays
Charts displayed on wearables (or other small screens) should be a simplified version of the mobile or desktop chart.
Do
Caution
Behavior
Charts provide interaction patterns that give users control over the data displayed. These patterns let users focus on a chart’s specific values or ranges.
The following recommended interaction patterns, styles, and effects (like haptic feedback) can improve user understanding of chart data:
- Progressive disclosure provides a clear path to unveiling details, accessible on demand.
- Direct manipulation allows users to directly act on UI elements, minimizing the number of actions needed on a screen, including: zooming and panning, pagination, and data controls.
- Changing perspective enables one design to work for different users and data types, such as data controls and motion.
Progressive disclosure
Reveal chart details using progressive disclosure, which allows users to view specific data points as needed.
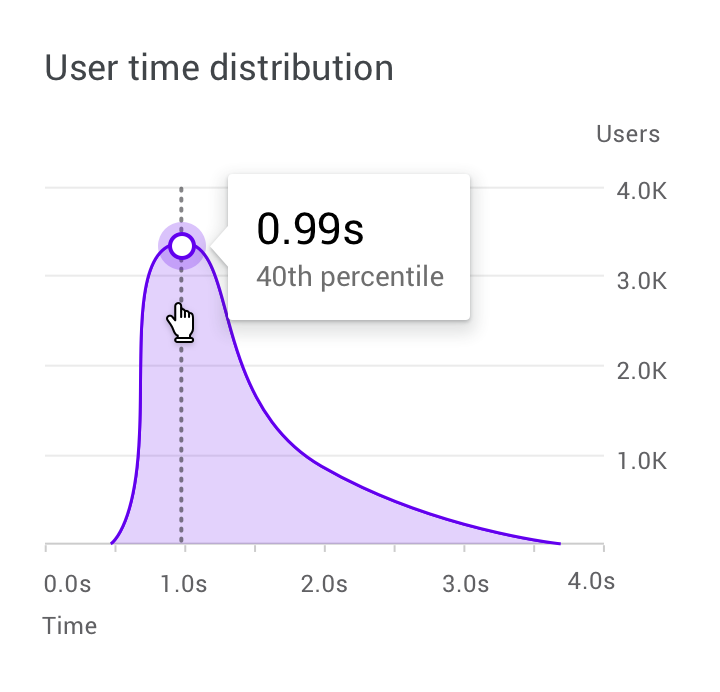
On desktop, a hover state can reveal more detailed data.
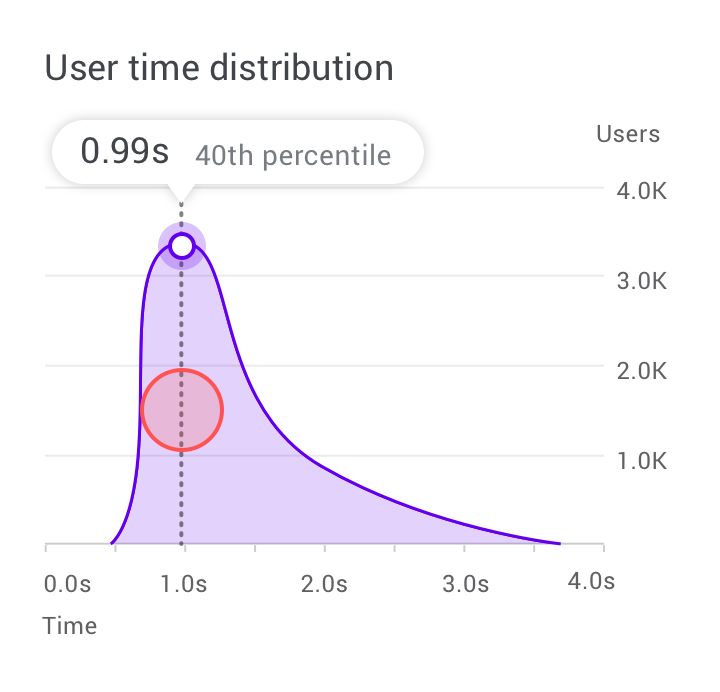
On mobile, a touch and hold gesture displays a tooltip placed above the chart.
Zooming and panning
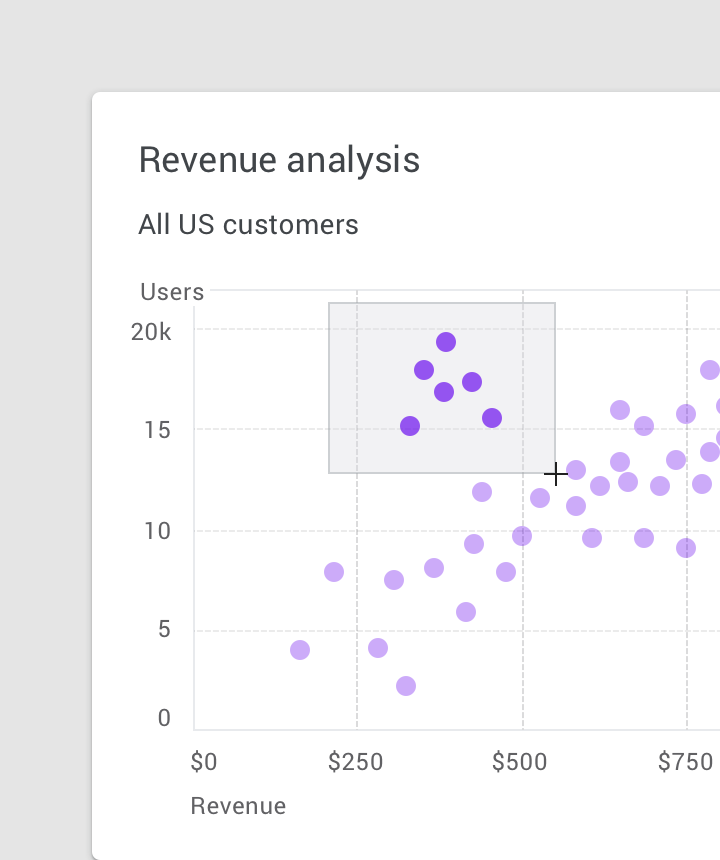
Zooming and panning are popular chart interactions that affect how closely users can study data and explore the chart UI.
Zooming
Zooming changes whether the UI is shown from either nearer or farther away. The device type determines how zooming is performed.
- On desktop, zoom occurs through clicking and dragging, or scrolling
- On mobile, zooms occurs using pinch to zoom
When zooming isn’t the primary action, it can be implemented via clicking and dragging (on desktop) or double tapping (on mobile).
Panning
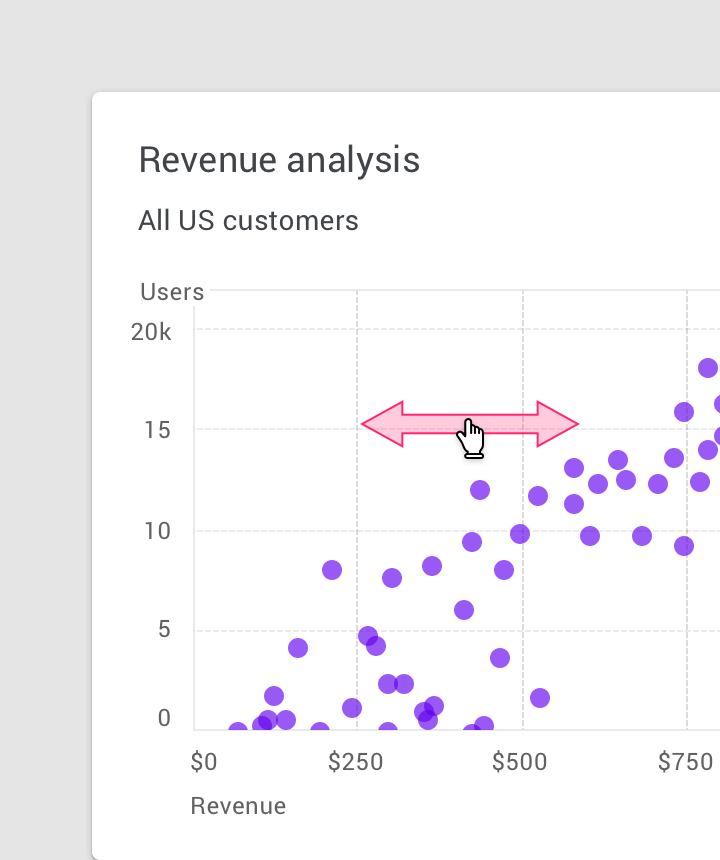
Panning allows the user to explore the UI that expands beyond the screen. It should be constrained in ways that make sense for the data displayed. For example, if one dimension of a chart is more important than another, the direction of panning can be restricted to only that direction.
The act of panning is often paired with zooming.
On mobile, panning is often implemented via gestures, such as one-finger swiping.
Pagination
On mobile, pagination is a common pattern that allows users to view the previous or next chart by swiping right or left.
Data controls
Data can be filtered or changed using toggle controls, tabs, and drop-downs.
These controls can also display metrics, while users adjust the controls.
Motion
Motion can enhance and reinforce the relationship between data and how users interact with it. Motion should be used purposefully (not decoratively), expressing the connection between different states and spaces.
Motion should feel logical, smooth, and responsive, without obstructing the user's journey.
Empty states
Empty graphs and charts can display content that suggests what to expect when data is available.
Where applicable, character animations can be shown to provide delight and encouragement.
Dashboards
Data visualization can be displayed across a series of multiple charts, in UIs called dashboards. Multiple, separate charts can sometimes better communicate a story, rather than one complex chart.
Dashboard design
A dashboard’s purpose should be reflected in its layout, style, and interaction patterns. Its design should suit how it will be used, whether it’s a tool for making a presentation or deeply exploring data.
A dashboard should:
- Prioritize the most important information (using layout)
- Display a focal point that prioritizes information according to hierarchy (using color, position, size, and visual weight)
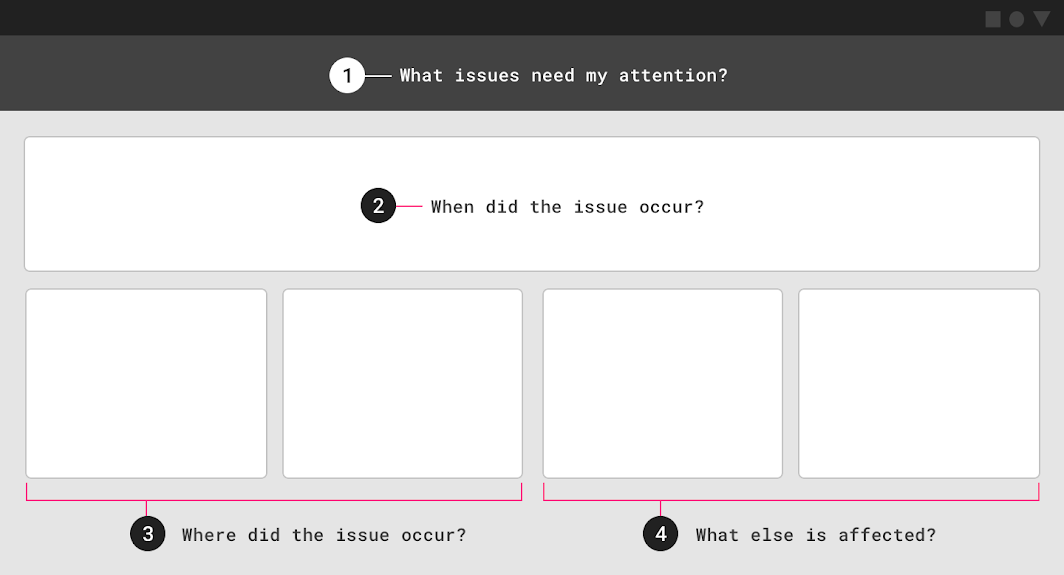
1. Issues that need attention
2. Time that issue occurred
3. Location that issues occurred
4. Other variables affected by the issue
Analytics dashboards
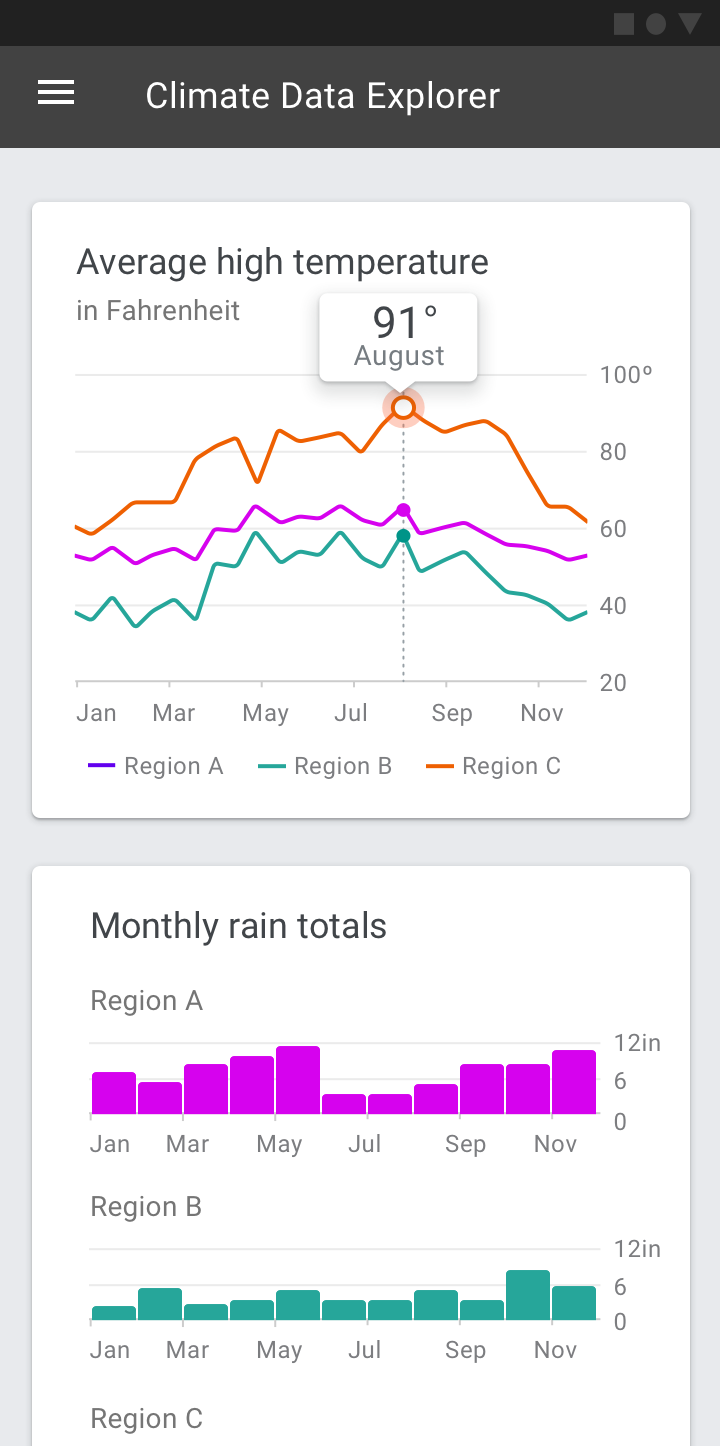
Analytics dashboards enable users to explore multiple sets of data and discover trends. Usually these dashboards include complex charts that enable the discovery of data insights.
Use cases include:
- Highlighting trends over time
- Answering “why” and “what if” questions
- Forecasting
- Creating in-depth reports
Analytics dashboard examples:
- Tracking ad campaign performance over time
- Tracking the sales and revenue generated by a product through its lifecycle
- Showing city population trends over time
- Tracking climate data over time
Operations dashboards
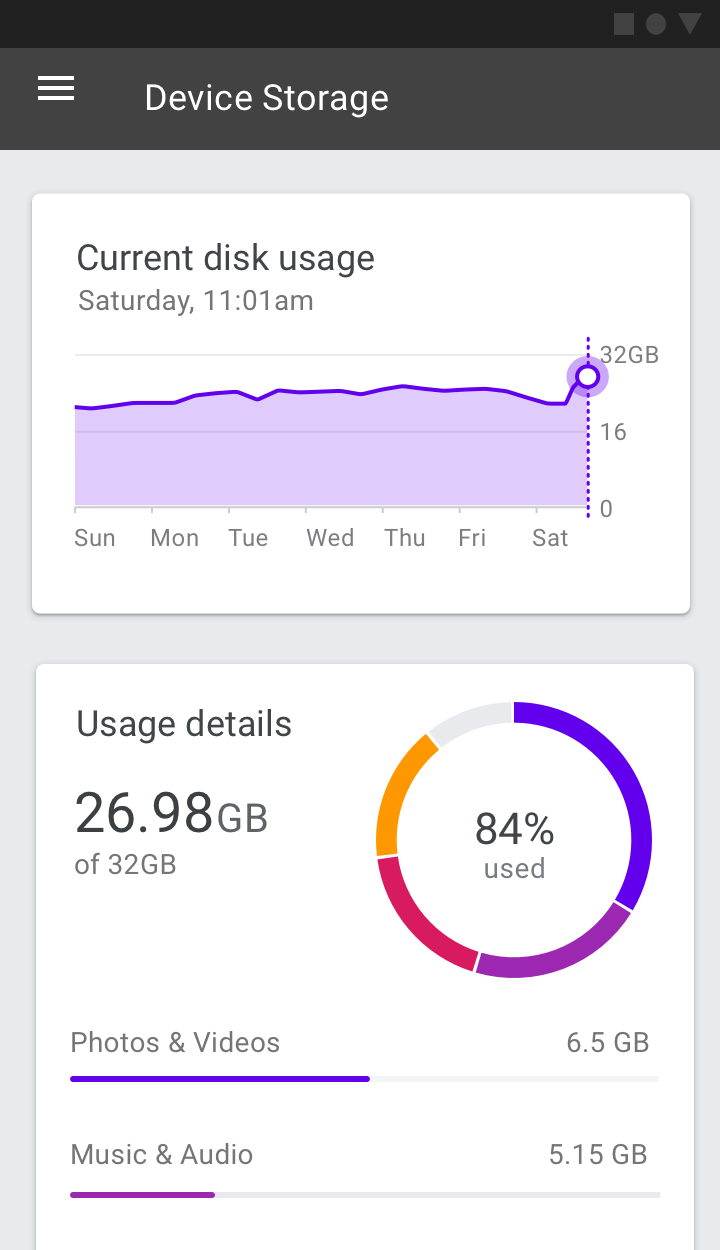
Operations dashboards are designed to answer a predefined set of questions. They are typically used to complete monitoring-related tasks.
In most cases, these types of dashboards feature current information arranged in a set of simple charts.
Use cases include:
- Tracking current progress against a goal
- Tracking system performance in real time
Operations dashboard examples:
- Tracking call center activities such as call volume, wait times, call length, or call types
- Monitoring the health of an app running on Cloud.
- Displaying stock market performance
- Monitoring telemetry data on a race car
Presentation dashboards
Presentation dashboards provide a curated snapshot on a topic of interest.
These dashboards typically include a few small charts or a scorecard, with dynamic headlines that explain the trends and insights provided in each supporting chart.
Use cases include:
- Providing an overview of key performance indicators
- Creating a high-level executive summary
Presentation dashboard examples:
- Providing an overview of investment account performance
- Providing a summary of product sales and market share data